9 Survey Tools for Academic Research in 2024

- Important Features

Survey Panels
- Additional Tools
1. SurveyKing
2. alchemer, 3. surveymonkey, 4. qualtrics, 5. questionpro, 6. sawtooth, 7. conjointly, 8. typeform, 9. google forms.
- Employee Feedback
- Creating the Survey
- Identity Protection
- Research Tools
Need a research survey tool? Features include MaxDiff, conjoint, and more!
These nine survey tools are perfect for academic research because they offer unique question types, solid reporting options, and support staff to help make your project a success. This article includes a detailed review of each of these nine survey tools. In addition to these survey tools, we include information about other research tools and survey panels.
Below is a quick summary of these nine survey tools. We list the lowest price to upgrade, which usually has the featured s needed for research projects. We also include a summary of the unique features of each tool. Most survey software has a monthly subscription; we denote when a tool requires annual pricing is required.
Important Features of Research Survey Software
Academic research surveys often require advanced question types to capture the necessary data. Many of the tools we mention in this article include these questions. However, some projects also require specialized features or the ability to purchase a panel. To help guide your decision in choosing the best piece of software for your project, we’ll summarize some of the most critical aspects.
Research Questions
Standard multiple-choice questions can only get you so far. Here are some question types you should be aware of:
- MaxDiff – measure the relative importance of an attribute. It goes beyond a standard ranking or rating by forcing respondents to pick the least and most valued items from a list. Rankings and other types only can you what is liked, not what is disliked. A statistical model will give you the probability of a user selecting an item as the most important. Latent class analysis can help you identify groups of respondents who value different attributes.
- Conjoint – Similar to MaxDiff in terms of finding importance, respondents evaluate a complete product (multiple attributes combined). This simulates real word purchasing decisions. A statistical model is also used to compute the importance of each item.
- Van Westendorp – Asks respondents to evaluate four price points. This shapes price curves and gives you a range of acceptable prices.
- Gabor Granger – Asks users whether or not they would purchase an item at specific price points. Price points are shown in random order to simulate real-world buying conditions. The results include a demand curve, giving you the revenue-maximizing price.
- Likert Scale – Measure attitudes and opinions related to a topic. It’s essential to use a mobile-ready Likert scale tool to increase response rates; many tools use a matrix for Likert scales, which could be more user-friendly.
- Semantic differential scale – a multirow rating scale that contains grammatically opposite adjectives at each end. It is used similarly to a Likert scale but is much easier for respondents to evaluate.
- Image heat map – Respondents click on places they like on an image. The results include a heat map showing the density of clicks. This is useful for product packaging.
- Net Promoter Score – Respondents choose a rating from 0-10. Many companies use this industry-standard question to benchmark their brand perception. This question type is necessary if your academic project measures brand reputation.
Anonymous Survey Links
Many academic surveys can deal with sensitive subjects or target sensitive groups. For this reason, assuring anonymity for respondents is crucial. Choosing a platform with an anonymous link is essential to increase trust with respondents and increase your response rates.
Data Segmentation
Comparing two groups within your survey data is essential for many research projects. This is called cross tabulation . For example, consider a survey where you ask for gender along with product satisfaction. You may notice that males are not satisfied with the product while females are.
You can take this further and compute the statistical significance between the groups. In other words, make the differences that exist between two data sets due to random chance or not. Your comparison is statistically significant if it’s not due to random chance.
Some lower-end survey tools may not offer any segmentation features. If this is the case, you need to download your survey data into a spreadsheet and create pivots of set-up custom formulas.
Skip Logic and Piping
If your academic project has questions that only a specific subset of respondents need to answer, then some logic will help streamline your survey.
Skip logic will take you to a new page based on answers to previous questions. Display logic will show a question to a user based on previous questions; perfect for follow-up.
Answer piping will allow you to carry forward answers from one question into another. So, for example, ask someone which brand names they have heard of, then pipe those answers into a ranking question.
Data Cleaning
Making sure your responses are high quality is a big part of any survey research project. For example, if people speed through the survey or mark all the first answers for questions, those would be low-quality responses and should be removed from your data set. Some tools highlight these low-quality responses, which can be a helpful feature.
For platforms that do not offer a data cleaning feature, it’s generally possible to export the data to Excel, create formulas for time spent, answer straight-lining, then remove the needed data. You can also include a trap question to help filter out low-quality responses.
Great Support
Many academic projects require statistical analysis or additional options for the survey. Using a tool with a support staff that can explain a statistical model’s intricacies, help build custom models, or adds features on request will ensure your project is a success. With SurveyKing, custom-built features are billed at $50 per hour, making custom projects feasible for small budgets.
Asking classmates to take your survey, posting it on social media, or distributing QR code surveys around campus is a great way to collect responses for your project. But if you need more responses with those methods, purchasing additional answers might be required.
A panel provider will enable you to target a specific demographic, job role, or hobby type. When setting up a survey with a penal provider, you always want to include screening questions (on the first page) to ensure they meet your criteria, as panel filters may not be 100% accurate. Generally, panel responses start around $2.50 per completed response. Cint is one of the largest panel providers and works well with any survey platform.
Additional Research Tools
Before deep diving into the survey software list, here are some additional tools and resources that might assist in your project. These can help shape your survey by conducting preliminary research or using it as a substitute if conducting a study is not feasible.
- Hotjar – They offer simple surveys and many tools to help capture feedback and data points from a website. A feedback widget customized for websites in addition to a heat map tool to show where users click the most or to identify rage clicks. A tool like this could be helpful if your academic projects revolve around launching or optimizing a website.
- Think with Google – Used to help marketers understand their audience. The site contains links to Google Trends to search for the popularity of key terms over time. They also have a tool that helps you identify your audience based on popular YouTube channels. Finally, they have a “Grow My Store Tool” that recommends tips for improving an online store.
- Google Scholar – A specific search engine used for scholarly literature. This can help locate research papers related to the survey you are creating.
- MIT Theses – Contains over 58,000 theses and dissertations from all MIT departments. The database is organized by department and lets you search for keywords.
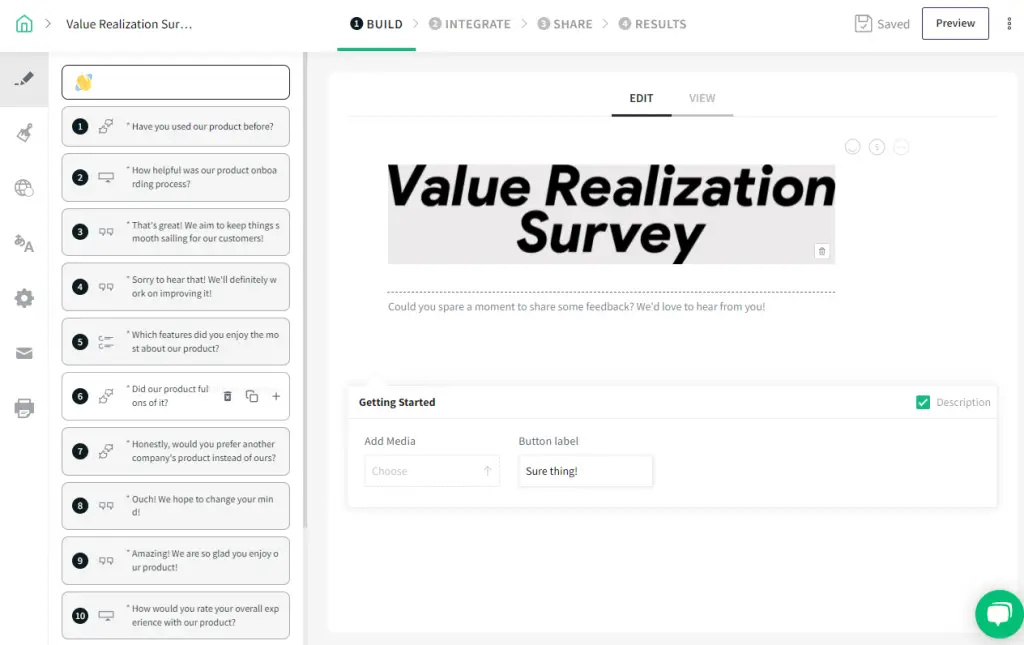
SurveyKing is the best tool for academic research surveys because of a wide variety of question types like MaxDiff, excellent reporting features, a solid support staff, and a low cost of $19 per month.
The survey builder is straightforward to use. Question types include MaxDiff, conjoint, Gabor Granger, Van Westendorp, a mobile optimized Likert scale, and semantic differential.
The MaxDiff question also includes anchored MaxDiff and collecting open-ended feedback for the feature most valued by a respondent. In addition, cluster analysis is available to help similar group data together; some respondents might value specific attributes, while other groups value others.
The reporting section is also a standout feature. It is easy to create filters and segment reports. In addition, the Excel export is well formatted easily for question types like ranking and Likert Scale, making it easy to upload into SPSS. The reporting section also gives the probability for MaxDiff, one of the few tools to offer that.
The anonymous link on SurveyKing is a valuable feature. A snippet at the top of each anonymous survey is where users can click to understand whether their identities are protected.
The software also offers a Net Promoter Score module which can come in handy for projects that deep dive into brand reputation.
Some downsides to SurveyKing include no answer piping, no image heat maps, no continuous sum question, and no premade data cleaning feature.
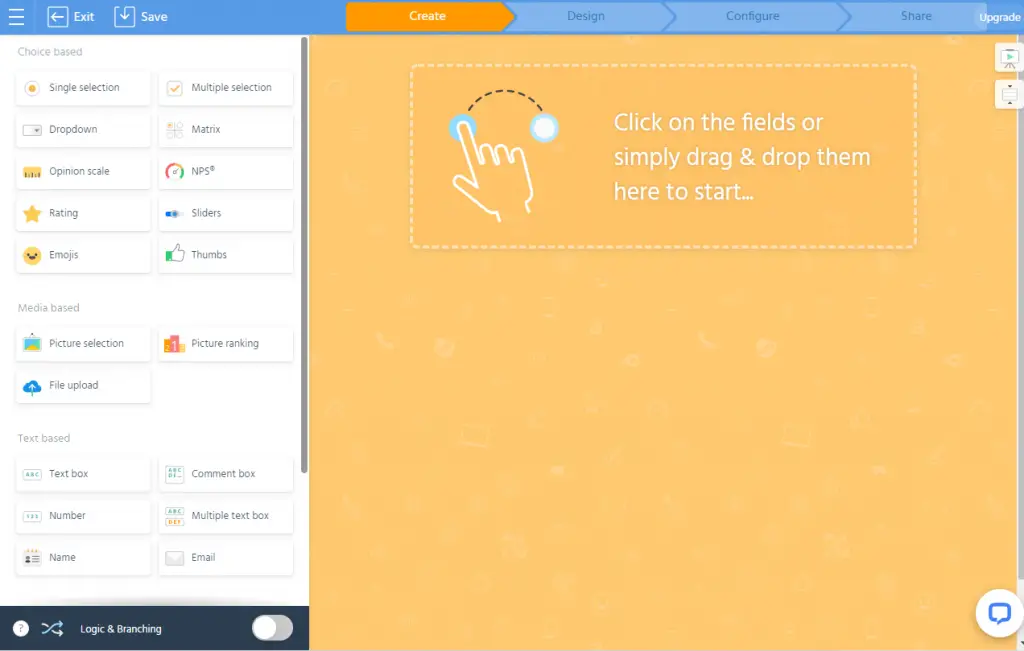
As a platform with lots of advanced question types and a reasonable cost, Alchemer is an excellent tool for academic research. Question types include MaxDiff, conjoint, semantic differential, image heat map, text highlighter, continuous sum, cascading dropdowns, rankings, and card grouping.
Reporting on Alchemer is a standout feature. Not only can you create filters and segment reports, but you can also create those filters and segments using advanced criteria. So if you ask a question about gender and hobby, you can make advanced criteria that match a specific gender and hobby.
In addition, their reporting section also can do chi-square tests to calculate the significant difference between the two groups. Finally, they also have a section where you can create and run your R scripts. This can be useful for various academic research projects as you can create custom statistical models in the software without needing to export your data.
Alchemer is less user-friendly than some other tools. The platform is a little clunky; things like MaxDiff require respondents to hit the submit button to get to the next set. Radio buttons need respondents to click inside of them instead of the area around them.
The pricing is reasonable for a student; $249 a month for access to the research questions. However, if you can organize your project quickly, you may only need one month of access.
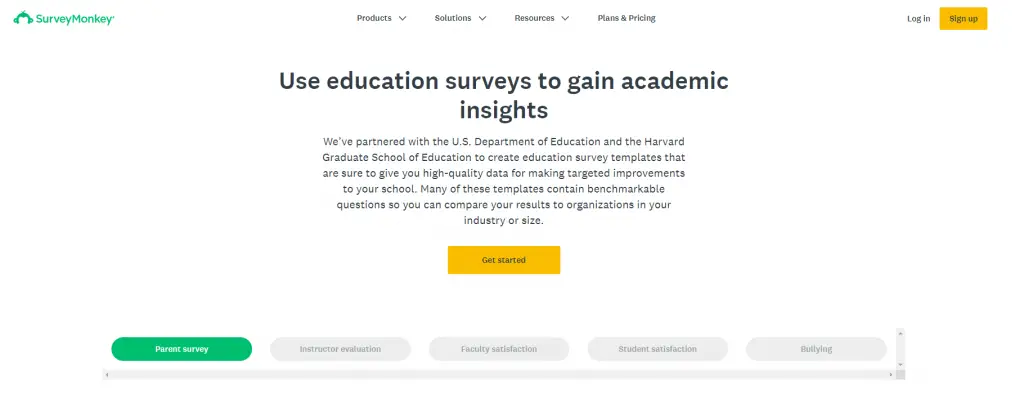
As the most recognized brand for online surveys, SurveyMonkey is a reliable option for academic research. While the platform does not have any research questions, it offers all the standard question types and a clean user interface to build your surveys.
One advanced question type they do have is the image heat map. Their parent company Momentive does offer things like MaxDiff and conjoint studies, but you would need to contact sales to get a quote, meaning this could be out of budget for students.
The reporting on SurveyMonkey is good. You can easily create filters and segments. You can also save that criterion to create a view. The views enable you to toggle between rules quickly.
One of the main downsides to SurveyMonkey is the cost. For the image heat map and to create advanced branching rules, you need to upgrade to their Premier plan, which costs $1,428 annually. To get statistical significance, you would need their Primer plan, which is $468 annually.
As the survey tool known for experience management, Qualtrics has some nice features for research projects. For example, they offer both MaxDiff and conjoint in addition to tools like drill-down, continuous sun, image heat map, and a text highlighter.
Reporting on the tool offers the ability to create filters and segments. For segments, it’s called a report breakout, and it appears there is no ability to create a breakout with advanced criteria. However, filers do allow you for advanced criteria.
There is a custom report builder option to create custom PDF reports. You can add as many elements as needed and customize the information displayed, whether a chart type or a data table.
Overall, Qualtrics could be more user-friendly and may require training. The survey builder and reporting screens could be more cohesive. For example, to add more answer options, you need to click the “plus” symbol on the left-hand side of the question instead of just hitting enter or clicking a button right below the current answer choice. In addition, the reporting section will display things like mean and standard deviation for simple multiple-choice questions before showing simple response counts.
One drawback to Qualtrics is the pricing. For example, you would need to pay $1,440 for an annual plan to use the research questions. But many universities have a licensing agreement with Qualtrics so students can use the platform. When you sign up for a new account, you can select academic use, enter your Edu email, and they will check if your university has a license agreement.
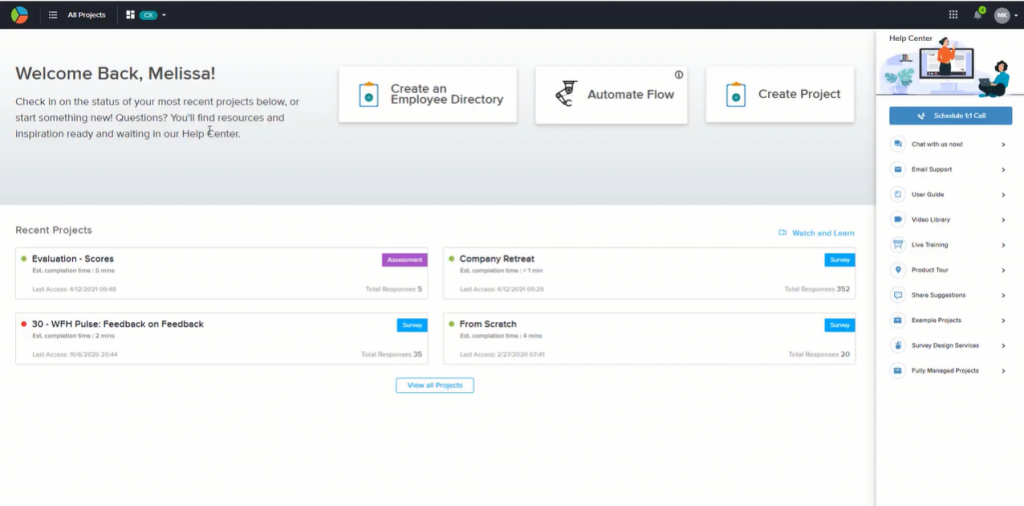
A survey platform with all the needed research questions, including Gabor Granger and Van Westendorp, QuestionPro is a quality research tool.
The reporting on QuestionPro is comprehensive. They offer segment reports with statistical significance using a t-test. In addition, they offer TURF analysis to show answer combinations with the highest reach.
For conjoint, offer a market simulation tool that can forecast new product market share based on your data. That tool can also calculate how much premium consumers will pay for a brand name.
QuestionPro is a little easier to use than Qualtrics. The UI is cleaner but still clumsy. You must navigate to a different section in the builder for things like quotas instead of just having it near skip logic rules. The distribution page has the link at the top but an email body below. The reporting has a lot of different pages to click through for each option. Small things like this mean there is a learning curve to use the platform efficiently.
The biggest downside of QuestionPro is the price. All of their research questions, even Net Promoter Score, would require a custom quote under the research plan. There another plan with upgraded feature types is $1,188 annually.
When it comes to advanced research projects, Sawtooth is a great resource. While their survey builder is a little limited in question types, they offer different forms of MaxDiff and conjoint. They also provide consulting services, which could help if your academic project is highly specialized.
For MaxDiff, they offer a bandit version, which can be used for MaxDiff studies with over 50 attributes. Each set of detailed attributes that are most relevant to the user. This can save panel costs because you can build a suitable statistical model with 300 bandit responses compared with 500 or 1000 standard MaxDiff responses.
Their MaxDiff feature also comes with a TURF analysis option that can show you the possible market research of various attributes.
For conjoint, they offer adaptive choice-based conjoint and menu-based conjoint. Adaptive choice tailors the product cards toward each respondent based on early responses or screening questions. Menu-based conjoint is for more complex projects, allowing respondents to build their products based on various attributes and prices.
Sawtooth has a high price point and may be out of the research for many academic projects. The lowest plan is $4,500 annually. If you need advanced tools like bandit MaxDiff or adaptive conjoint, you must pay $11,990 annually. They do have a package just for MaxDiff starting at $2,420.
Conjointly is a platform geared towards research projects, namely market research. Not only do they have the standard research questions, but they also have a bunch of unique ones: claims testing, Kano Model testing, and monadic testing. There are also question types like feature placement matrix, which combines MaxDiff and Gabor Granger into a single question.
You can either use your respondents or select from a survey panel. The survey panel option comes with predefined audiences, which makes scouring respondents a breeze.
One unique feature is that they monitor in real-time speeders and other criteria for low-quality respondents. If a respondent is speeding through the survey, a warning message is displayed asking them to repeat questions before being disqualified. If a question has a lot of information to digest, the system automatically pauses, forcing the respondent to thoroughly read the question before answering.
The pricing is a little steep at $1,795 annually. Response panels for USA residents appear to start around $4 per completed response. The survey builder and reporting section could be cleaner, with different options in many places. It may take time to get up to speed.
While Typeform doesn’t have any research questions, it is a very well-designed and easy-to-use tool that can assist with your academic survey. For example, it could gather preliminary data for a MaxDiff study.
Typeform offers a lot of integrations with other applications. For example, if your project requires exporting data to a spreadsheet, then Google Sheets or Excel integration might be helpful. Likewise, if your research project is part of a class project, then the Slack or Microsoft Teams integration might help to notify other team members when you get responses.
One unique feature of Typeform is the calculator feature. Add, subtract, and multiply numbers to the @score or @price variable. These variables can be recalled to show scores or used in a payment form.
The reporting in Typeform is basic. There is no option to create a filter or a segment report. Any data analysis would need to be done in Google Sheets or Excel.
For $29 a month, you can get 100 responses, or $59 a month, you can collect 1,000 responses each month.
One of the widely used survey tools, Google Forms , is a decent platform for an academic research survey. Unfortunately, the software doesn’t offer any research questions. Still, the few questions it has, like multiple choice, rantings, and open-ended feedback, are enough to collect essential feedback for simple projects or preliminary data for more complex studies.
Skip logic is straightforward to set up on Google Forms. For example, you can select what section to skip based on question answers or choose what to skip once a section is complete. Of course, you can’t create complex rules, but these simple rules can cover many bases.
Overall the user interface is elegant and straightforward. The form design is also elegant, meaning the respondent experience is excellent. Unlike other survey tools, which can have a clunky interface, there is no worry about that with Google Forms; respondents can quickly navigate your form and submit answers.
The spreadsheet export is very well formatted and can be easily imported into SPSS for advanced analysis. However, the export has the submission date and time but has yet to have the time started, so calculating speeders is impossible.
ABOUT THE AUTOR
Allen is the founder of SurveyKing. A former CPA and government auditor, he understands how important quality data is in decision making. He continues to help SurveyKing accomplish their main goal: providing organizations around the world with low-cost high-quality feedback tools.
Ready To Start?
Create your own survey now. Get started for free and collect actionable data.

Business Process Improvement Consulting: Expert Solutions
Definition: A business process improvement consultant will help design and implement strategies to increase the efficiency of workflows across your o...

8 Excel Consulting Services to Use in 2024 + VBA Support
These 6 Excel consulting firms offer support, training, and VBA development to help you automate tasks and increase efficiency when using Microsoft Ex...
9 Great SurveyMonkey Alternatives to Use in 2024
Discover alternatives to the most popular online survey tool, SurveyMonkey. Gain an understanding of where SurveyMonkey lacks in features and get intr...

7 Great Qualtrics Alternatives to Use in 2024
These seven alternatives to Qualtrics offer either more features, a lower cost, or a cleaner user interface. These alternative platforms also include ...

Union Negotiation Consulting: Planning Labor Agreements
A labor union negotiation consulting engagement involves quantifying member needs, proposing contract language, and developing communication strategie...

Creating a Transactional Survey: Examples + Template
Definition: A transactional survey captures customer feedback after a specific interaction, referred to as a touchpoint. This survey type provides dir...

Hire an Excel Expert: Automation + VBA Development
An Excel expert will help you to complete your projects within Microsoft Excel. A good Excel expert should be proficient in advanced formulas such as ...

Creating an Anonymous Employee Survey + Template, Sample Questions
Definition: An anonymous employee survey is a convenient way to collect honest feedback in the workplace. The survey can either measure employee satis...
Improving Fleet Performance Through Driver Feedback Surveys
In the US, the trucking industry generated $875.5 billion in gross freight revenues, accounting for 80.8% of the country’s freight invoice in 20...
13 College Study Tips to Use in 2023
These 15 college study tips will help you succeed in your academic career.
Maximizing the Value of Skills Assessment Tools Using Surveys
When you apply for a job, it’s only natural that you’ll aim to present the best possible version of yourself. You’ll focus on your best skills a...
Creating UX Surveys: 6 Tips and Examples
UX surveys are used to help create a great user experience. A good UX survey will incorporate a variety of question types to help understand what user...
5 Web Consultants to Use in 2023: Design + Development
Definition: A web consultant can update an existing website design, create a custom website, help increase traffic, recommend layout changes, and even...
Creating a Targeted Survey: Panels to Reach Your Audience
Definition: A targeted survey is used to research a specific audience, frequently utilizing a survey panel provider. A paneling service generally has ...
8 Typeform Alternatives to Use in 2023
These seven alternatives to Typeform offer a lower cost or additional features. In addition, these alternative platforms include question types that T...

6 Ecommerce Skills For Professionals + Students
Ecommerce has occupied its leading niche in the world, allowing us to draw certain conclusions. For example, it is not surprising that more specialize...
Ecommerce Analytics Explained + Tools to Use
Definition: Ecommerce analytics is the practice of continuously monitoring your business performance by gathering and examining data that affects your...
Planning a Survey: 6 Step Guide + Best Practices
Planning a survey involves six steps: Set objectives, define the target audience, select the distribution method, organize external data, draft the su...
4 Survey Consulting Services to Use in 2023
Definition: These 4 survey consulting services offer planning, design, development, and support to help complete your survey project. Whether it’s f...
Excel Automation Explained: VBA Code + Sample Workbooks
Definition: Excel automation will streamline repetitive tasks such as updating data, formatting cells, sending emails, and even uploading files to Sha...
Hire a Financial Modeling Consultant: Forecasts + Valuations
Definition: A financial modeling consultant will provide expertise in planning budgets, generating forecasts, creating valuations, and providing equit...
Excel Programming Services: Development, Macros, VBA
Definition: An excel programmer can be hired to organize workbooks, create custom formulas, automate repetitive tasks using VBA, and can consult on h...
Market Research Surveys: Sample Questions + Template
Definition: Market research surveys are a tool used to collect information about a target market. These surveys allow businesses to understand market ...

What do Americans Value Most in the Coming Election? A Comprehensive and Interactive 2020 Voter Poll
SurveyKing set out on a mission in the fall of 2020, to poll American's and help identify, with quantifiable data, what issues american are most focus...
Get Started Now
We have you covered on anything from customer surveys, employee surveys, to market research. Get started and create your first survey for free.
Best Survey Tools for research in Academics
This post may contain affiliate links that allow us to earn a commission at no expense to you. Learn more

Top researchers use the best survey tools for research in academics to generate, validate, and support their theses. Online surfer software allows researchers to collect and analyze the data more effectively and efficiently.
Online survey software has become popular because they allow researchers to reach more people at less cost than traditional methods.
Today we will try to identify the best online survey software. We will compare the most popular survey software. We will also explore the limitations of free survey tools and discuss the merits of premium tools.
Table of Contents
First off, why survey research?
Survey research is viewed as an easy research approach. It’s kind of like breathing, most people think it’s easy and doesn’t think much about it. For researchers that do mediation or sports, you will know how important and difficult to breathe right.
As with all research methods and approaches, it is easy to conduct a low-quality survey rather than one of high quality and real value. Kate Kelley et al. wrote a paper on Oxford Academics that provides a checklist of good practices for conducting and reporting surveys. [1]
They talked about the pros and cons of conducting survey research:
- Real-world observations are used in research (empirical data).
- By including a large number of people or events, we have a greater chance of obtaining a representative sample and generalizing the results to the whole population.
- Surveys can generate a large amount of data in a short amount of time at a relatively low cost.
- Therefore, researchers can set a specific time frame for a project, which assists in the planning and delivery of the final product.
- Researchers can get distracted by focusing on a wide coverage rather than exploring the implications of those data for relevant issues, problems, or theories.
- The data produced usually lacks detail or depth on the topic being investigated.
- It is challenging to achieve a high response rate to a survey, especially when it is mailed, but it is also difficult when it is conducted face-to-face or via telephone.
10 Do’s and Don’ts of Survey Research
Top researchers know how to conduct research that is trustworthy, objective, and rigorous.
Novice researchers, on the other hand, tend to get distracted by “fancy stuff” fall into the trap of using great data to save a weak research question.
Following is a list of Do’s and Don’ts:
- Do proper research BEFORE and know the topic you wish to research .
- Do expand your knowledge, investigate related areas, and talk with other researchers and practitioners within the field you are studying.
- Do have a strong research question. The purpose of good research is to address a single, clear, and explicit question.
- Do be laser-focused. A study that aims to answer a lot of questions is often weak.
- Do keep questions unbiased and avoid leading questions
- Do consider your sample and sampling design for a proper survey
- Don’t put survey data before the research question. Weak studies merely collect a range of data and then look for associations that appear ‘interesting’ or ‘significant’.”
- Don’t let the choice of methods determine which questions will be asked.
- Don’t ask questions that can’t be answered
- Don’t ask questions that have already been answered.
You might also like:
- 10 Best Literature Review Tools For Researchers
- Jasper AI Review (2023) – Does It Work For Academic Users?
- 20 Best Tools For Interactive Online Examinations In Academia
- 14 Best Tools For Finding Big Trends Before Others
Best Survey Tools for Research
Here are the top options that we have selected based on ease of use, performance, value, and compatibility. Microsoft Forms will make our list because of the very fact that it works with Microsoft Teams. This makes a lot of sense for certain groups of users.
SurveySparrow – Best User Experience
Qualtrics – most trusted online survey tools.
- SurveyMonkey – Best Overall
- QuestionPro – best for experience research
- SurveyLegend – Emphasis on Privacy
Zoho Survey
Google forms – free online survey tool great for individual projects.
- Need help with writing? Check out the Best Writing Tools here .
- Finished writing? Make sure you check it with Best Proofreading Tools to avoid embrassing typos.
The SurveySparrow Survey Tool is a simple to use, automated survey tool created by a team of researchers and application developers. The SurveySparrow Survey Tool has many benefits for academic users and scientific researchers due to its simplicity, power, and flexibility.
They can create a poll or an online survey in a matter of minutes by using the SurveySparrow template library. SurveySparrow provides you with all the tools needed to build your own surveys in just seconds!
You will be able to design your own customized polls that are tailored specifically to your needs. It offers a variety of features, including surveys, questionnaires, and feedback forms.
SurveySparrow can be used to create surveys in a variety of languages, including English, French, Spanish, and German. Surveys can be customized with a range of question types, including multiple-choice, open-ended, and rating scales. SurveySparrow Survey results can be analyzed and visualized in a variety of ways, including graphs and charts. Survey data can be exported to a variety of formats, including Excel, PDF, and JSON.
- Free for 500 responses per month.
- Paid version plans start at $19/month and include up to 5,000 responses per month.
Qualtrics is one of the best online survey tools for prestigious universities. Truth be told, this survey software probably came to you because your institution uses it. Not the other way round.
Qualtrics is trusted by 100+ top universities and has all the features needed, such as artificial intelligence for analyzing survey data, different types of questions, ready-made templates.
It doesn’t stop with that – it has logic branching, email triggers, and displays logic to make the experience of using the program pleasant. Qualtrics also helps you understand data better with their Stats IQ tools including predictive models that are easy to find through natural language processing.
The Text IQ capability allows qualitative analysis on text comments then suggests topics with sentiment scores that can be used in your research. The information repository or IQ Directory lets you store important data like beliefs/sentiments/beliefs for future use in research projects too! They have multi-channel distribution as well as QR codes for those who don’t have smartphones.
My guess is that you either love or hate this tool and wish your organization just leave you alone. Well, the tutorial below may help ease your pain.
- 14 Best Tools for Finding Big Trends Before Others
- 10 Best Literature Review Tools for Researchers 2023
- Jasper AI Review (2023) – Does it work for academic users?
- 10 Best Literature Review Tools for Researchers
- Jasper AI Review
- 20 Best Tools for Interactive Online Examinations in Academia
SurveyMonkey – Best Overall
Many people conduct their first online surveys because of SurveyMonkey. It was one of the best online survey tools for a while because of its simplicity. When it came out some 10 years ago, an online survey is meant to be ugly, chunky, and a pain to do.
SurveyMonkey positioned itself as a free survey software (limit to 10 questions at the time). This free version went viral like Hotmail in its early days. People love how easy its survey templates are for customer satisfaction surveys and employee surveys.
The survey responses tend to be higher with SurveyMonkey back in the days when there aren’t that many good options that we have listed here today.
Now, SurveyMonkey is one of the few public online survey tools companies that have shareholders to answer to. This keeps the online survey creator busy improving existing and innovating in order to deliver value to shareholders.
As a trusted name, SurveyMonkey has been providing survey tools to academics and scientific researchers for over a decade. Through its robust system, the company has helped millions of people be heard and has completed over 10 million surveys. With their free and paid services.
SurveyMonkey continues to be an important tool in the academic and scientific community by providing a potent tool for data collection and analysis. Surveys are one of the best ways to collect information from your audience. They can help you understand what they think about certain topics or how they feel about something that’s happening around them.
The tool offers a wide range of features, including the ability to create surveys with a variety of question types, distribute surveys via email or social media, and view response data in real-time.
Survey Monkey also offers a number of integrations with other software applications, making it easy to collect and analyze survey data.
- Survey monkey is Ease of use
- Variety of question types
- Flexible survey design
- Survey monkey provided customizable reports
- Free account
- Numerous integrations
- Customer support is available 24/7.
- A limited number of questions can be asked.
- The low response rate from participants.
- Some survey participants may find the survey questions to be too personal or intrusive.
- Limited ability to analyze survey results.
- No ability to target survey participants by demographics or other factors.
- Team Advantage $25/month
- Team Premier $75/month
- Enterprise (Contact to the Supplier)
- Want to get the creative juice flowing? Check out the Best Mind Mapping Tools
- Looking for research ideas? Check out these Academic Search Engines
QuestionPro – Best for experience research
QuestionPro is a good survey software for academic researchers because it comes with multiple pre-built templates and over 30 types of questions which you can use to create personalized surveys and questionnaires.
As a more commercial tool, QuestionPro emphasizes its survey solution for valuable insights.
It also computes scores on how many questions got answered and presents the overall scores once it is completed. You can then export results into CSV, Excel, and other formats or share them through the mobile app.
Additionally, it is multilingual, with a full set of reporting features like text and trend analytics, segmentation, and real-time summary. Lastly, for academic research, you get unlimited access to the highest paid license if you’re a student in an academic institution.
QuestionPro may not be a good option if you need features like the multimedia integration that makes the survey more interactive for your respondents.
- Pricing can be expensive for larger surveys.
- Some features are not available without paying more
- Question types are limited
- Can be difficult to use for complex surveys
- Essential account = free trial
- Advance account price is $129/month
- Team Edition for Multiple users (Contact Support team)
- 10 Best Literature Review Tools for Researchers
- Swamped with tasks and multiple projects? Try the Best Project Management Tools to stay ahead of the schedule
- Still taking notes in meetings? Try these Transcription Tools For Researchers and focus on what matters
SurveyLegend – Emphasis on Privacy
For the past few years, there has been a movement of people interested in their privacy and data, which is why sites like SurveyLegend were created to provide an anonymous survey tool for academic users and scientific researchers.
These surveys are designed with security features such as the use of two-factor authentication, encryption, and fraud protection.
SurveyLegend is a survey tool that is known for making surveys that are much pleasing to the eyes. It has a simple learning curve and easy-to-use drag and drop interface, which allows users to build decent surveys in minutes. The survey app is highly customizable and lets you put together surveys with the help of a myriad of templates.
You can also share surveys through multiple channels like email, SMS, social media, etc. with a single click! The powerful real-time analytics lets you collect insights and information about your customers effortlessly. Overall, SurveyLegend is a free survey creator that’s fairly good but you can’t expect it to be as mobile-friendly as it claims to be.
Pricing/ Free Version
- Free plan Forever
- Pro plan is $15 per month
- A business plan is $25 per month
- The legendary plan is $65 per month
SoGoSurvey
The most compelling feature of SoGoSurvey is its ability to generate results for both binary and multiple-choice responses, as well as its easy-to-use format.
SoGoSurvey has great potential for use in academic settings where research and teaching intersect and is a valuable addition to the suite of tools available to scientists and researchers worldwide.
With its deep analytical reports, robust data security, intuitive UI, and responsive customer support, SoGoSurvey is a tool worth considering. However, on the downside, you will have to deal with a steep learning curve, and the free version of the software comes with limited functionalities.
Pricing/ Free plan
- Plus Plan is $25 per month.
- Pro Plan is $66 per month.
- Premium Plan is $99 per month.
- 15 Best Online Tools For Student Feedback And Course Evaluations
- We Help scientists make more impact
Zoho Survey is a free, easy-to-use online survey tool. It’s a great choice for individuals and small businesses looking to conduct surveys with 10 questions or less. The interface is slick and easy to navigate, with help options relative to each field.
There are also templates if you’re not sure what type of survey you’d like to create. Surveys can be done with an email link or through the Zoho Survey app on iOS or Android devices.
You can create, publish and analyze surveys through this tool. The tool allows users to collect feedback from customers and employees, and measure customer satisfaction levels. Zoho Survey also offers features such as data analysis, reporting, and collaboration, which help users to make better business decisions.
- Plus Plan: $25
- Pro Plan: $35
If you have smaller individual projects such as teaching a small Ph.D. class, you may just Google Forms.
Google Forms is a good survey software for academic researchers because it is easy to use, has a customizable design, provides real-time response information and charts, and can be synced with other Google products. Additionally, Google Forms can also be used as a quiz maker for educational professionals.
It’s the best free option. But, it’s also quite limited in terms of usability. So I’d say it’s good for small-scale research projects. But, it can take significantly more time to make it work for larger more complex research.
Responses are automatically logged into Google Sheets, allowing them to be easily transferred to an Excel spreadsheet or database.
Pricing: Free.
I love the simplicity in the video below that shows you how to create and grade questions automatically.
Famous tools that didn’t make our list
Microsoft forms – limited coverage .
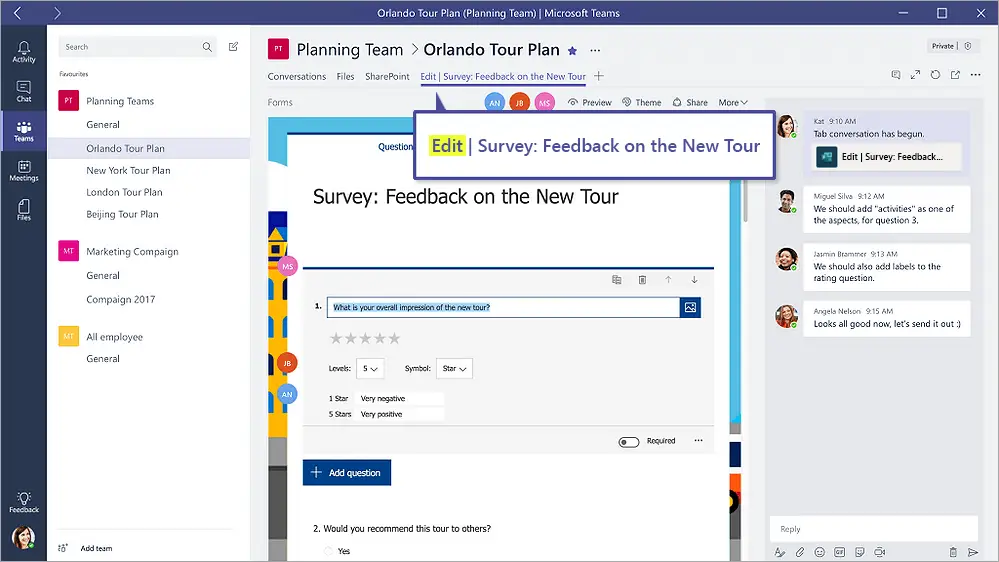
Most people, I mean me mostly, don’t know what’s the other green icon Microsoft app other than Excel. Until Teams become the tool your boss uses to harass you more instantaneously. And, one day, some HR is smart enough to figure out how to save cost from using survey tools and opt for the Microsoft forms.
My point is if your sample is confined in the Microsoft work environment, then Microsoft Forms may work as it is integrated with Teams.
For academic research, you can still use Microsoft Forms to build forms, but its features are quite limited. But because of its lack of advanced features, it’s incredibly beginner-friendly.
How to choose a survey tool for academic projects
The best online survey tool offers a comprehensive questionnaire-building solution and metric analysis tools.
First of all, context matters – for some use cases such as teaching a small research class, free survey tools may just be enough.
Related considerations are:
- Budget: This is an obvious one – if you don’t have a fat budget, then consider reducing the scope
- Scope and complexity: Always link the scope and complexity to the research question – be ruthless in cutting down unnecessary questions or functions that do not add to the research question
- Know the difference between must-have and nice-to-have: Do you really need a multilingual survey or a question library?
Secondly, focus on your objectives. Back when I was a management consultant doing consumer research for big brands, actionable insights are what matters.
It doesn’t mean it’s less rigorous than academic research. It just means clients want you to go further and tell them what are actions needed based on what you know. And, how you know what you know is truthful.
- Survey logic. This is determined by the complexity of your research project. Usually, only paid tools have an easy-to-manage survey logic function. Don’t overwhelm yourself with overcomplicated survey logic
- Data collection consideration. How easy is it to collect and manage the data? Does it work well with other data analytics tools?
Finally, think about collaboration and scalability. Can you outsource to a research vendor? Or, are you the research vendor? Assuming you are working mostly solo, then you want to consider the below.
- Ease of use: Does it require any coding skills? Is it easy to overview the survey questions?
- Template Relevance: The best scenario is for you to get the survey templates that top researchers have used and see how the survey results lead to the research paper
- Collaboration: Do you need to work with others? Does the survey tool support it?
- Audience: Who are you surveying? What tools or channels will be more relevant for them? Some tools can embed questions on social media.
So, choose the right online survey tool that works the best for you.
Final Thoughts
It is important to find a survey tool that is best suited to the needs of your research since all of the above online survey tools have their advantages.
It is also important to take into consideration the time that you have to devote to this survey in order to get the most accurate results.
The way that you set up your survey can also shape how well it works for you, so it is important to choose surveys wisely and invest in the tools that are right for you. In this article, I try my best to talk about the best survey tools for research and I hope you really enjoy reading this article.
[1] https://academic.oup.com/intqhc/article/15/3/261/1856193
There is more.
Check out our other articles on the Best Academic Tools Series for Research below.
- Learn how to get more done with these Academic Writing Tools
- Learn how to proofread your work with these Proofreading Tools
- Learn how to broaden your research landscape with these Academic Search Engines
- Learn how to manage multiple research projects with these Project Management Tools
- Learn how to run effective survey research with these Survey Tools for Research
- Learn how get more insights from important conversations and interviews with Transcription Tools
- Learn how to manage the ever-growing list of references with these Reference Management Software
- Learn how to double your productivity with literature reviews with these AI-Based Summary Generators
- Learn how to build and develop your audience with these Academic Social Network Sites
- Learn how to make sure your content is original and trustworthy with these Plagiarism Checkers
- Learn how to talk about your work effectively with these Science Communication Tools

Leave a Comment Cancel reply
Save my name, email, and website in this browser for the next time I comment.
We maintain and update science journals and scientific metrics. Scientific metrics data are aggregated from publicly available sources. Please note that we do NOT publish research papers on this platform. We do NOT accept any manuscript.
2012-2024 © scijournal.org

7 Best Survey Tools for Research [2023]

As a Ph.D. researcher, one of the essential components of your academic journey is conducting surveys. Surveys serve as a valuable tool for collecting data, opinions, and insights from a targeted group of respondents. In today’s digital era, selecting the right survey tool is critical to ensure that your research process is efficient and yields accurate results. In this comprehensive guide, we will explore the best survey tools for research, discussing their popularity, pros, cons, and addressing frequently asked questions.
Why Choose the Best Survey Tools for Research
Before diving into the specifics of survey tools, it’s crucial to understand why selecting the right tool matters. As a researcher, your primary goal is to gather high-quality data that supports your research objectives and contributes to the academic community’s knowledge. Here are some key reasons why choosing the right survey tool is essential:
- Data Quality: The survey tool you choose can impact the quality of the data you collect. A well-designed tool helps ensure that respondents understand and answer questions accurately.
- Efficiency: The right tool can streamline the survey creation process, saving you time and effort. This efficiency allows you to focus on other aspects of your research.
- Data Analysis: Many survey tools offer built-in data analysis and reporting features, simplifying the process of extracting meaningful insights from your data.
- Scalability: Depending on your research scope, you may need a tool that can handle a large number of respondents and responses without compromising performance.
- Customization: Your research may require specific question types, logic branching, and branding. Choosing a tool that allows for customization is crucial.
Now that we understand the importance of selecting the right survey tools, let’s explore some of the best options available for Ph.D. research.
1. Google Forms
Google Forms is a free and user-friendly online survey and form-building tool developed by Google. It is part of the Google Workspace suite of productivity tools and is widely used for creating surveys, quizzes, and feedback forms for various purposes, including academic research.

Key Features:
- User-Friendly: Google Forms offers a straightforward and intuitive interface, making it easy for users, including those familiar with Google Workspace, to create surveys.
- Basic Customization: Users can customize the appearance of forms with themes and add logos, providing basic branding options.
- Integration with Google Sheets: Survey responses are collected directly in Google Sheets, allowing for easy data storage and basic analysis.
- Question Types: Google Forms supports various question types, including multiple choice, short text, long text, and scale questions.
- Simple Surveys: It is suitable for creating simple surveys and feedback forms, making it accessible to users with varying levels of technical expertise.
- User-friendly and easy to set up, especially for those familiar with Google Workspace.
- Allows for basic survey customization and integration with Google Sheets.
- Suitable for simple surveys and research with fewer complexities.
- Responses can be collected directly in Google Sheets for basic data analysis.
- May not provide advanced features required for complex research projects.
- Limited customization and analysis options compared to more robust survey tools.
- Integration options with external tools and applications are limited.
Google Forms is an excellent choice for researchers who need a straightforward and accessible tool for basic surveys and feedback forms.
It is particularly well-suited for academics who already use Google Workspace, as it seamlessly integrates with other Google productivity tools.
However, for more complex research projects requiring advanced features, researchers may need to explore other survey tools with enhanced capabilities.
2. Qualtrics
Qualtrics is a widely recognized and highly popular survey and research platform used by a variety of organizations, including academic institutions, for conducting surveys and collecting research data. It offers a comprehensive suite of features designed to meet the needs of researchers and businesses alike.

- Advanced Survey Customization: Qualtrics provides extensive customization options, allowing researchers to create surveys tailored to their specific needs. This includes a wide range of question types, logic branching, and survey design customization.
- Survey Logic and Branching: Researchers can implement complex survey logic and branching to ensure that respondents are presented with relevant questions based on their previous responses.
- Data Analysis and Reporting: Qualtrics offers robust data analysis and reporting tools, making it easier to derive meaningful insights from survey data. Researchers can create charts, graphs, and export data for further analysis.
- Survey Distribution: Surveys can be distributed via email, social media, website embedding, or QR codes, offering flexibility in reaching respondents.
- Integration: Qualtrics integrates with various third-party applications and services, facilitating data transfer and analysis.
- Highly customizable and suitable for complex research projects.
- Advanced survey logic and branching capabilities.
- Robust data analysis and reporting features.
- Supports various question types and distribution methods.
- Trusted by academic researchers and institutions.
- May have a steeper learning curve, especially for beginners.
- The free version has limitations, including a cap on the number of responses.
- Access to advanced features and enhanced support typically requires a paid subscription.
Qualtrics is a comprehensive and powerful survey tool that is particularly well-suited for researchers working on complex research projects that demand advanced customization and analysis capabilities.
While it may require some time to become proficient with the platform, its robust features make it a top choice for many academic researchers and institutions.
Also Read: How to Design Questionnaire for Research
3. Zoho Survey
Zoho Survey is an online survey tool provided by Zoho Corporation, known for its suite of business software applications. This survey tool allows users to create and distribute surveys for various purposes, including academic research.

- Survey Creation: Zoho Survey offers an intuitive interface for creating surveys with various question types, logic branching, and design customization.
- Data Collection: Surveys can be distributed via email, social media, or embedded in websites to reach respondents.
- Data Analysis: Zoho Survey provides basic data analysis and reporting features, allowing researchers to analyze survey responses.
- Integration: As part of the Zoho ecosystem, it integrates with other Zoho applications for streamlined data management.
- User-friendly interface, making it accessible for both beginners and experienced users.
- Customizable survey design with options for branding.
- Integration with other Zoho apps for efficient data handling.
- Supports various question types and survey distribution methods.
- The free plan has limitations, including a cap on the number of responses.
- Advanced features may require a paid subscription.
- While it offers basic reporting, it may not provide as extensive data analysis tools as some other survey tools.
Zoho Survey is a versatile tool suitable for researchers who prefer an integrated approach to data collection and analysis within the Zoho ecosystem.
It offers user-friendly survey creation and distribution, making it accessible to a wide range of users, including academics conducting research.
However, researchers with more complex survey needs may want to explore the paid plans for advanced features.
4. SurveyMonkey
SurveyMonkey is a widely recognized and user-friendly online survey tool that caters to various users, including academic researchers, businesses, and organizations.
It provides a range of features for creating and distributing surveys, collecting responses, and analyzing data.

- Survey Design: SurveyMonkey offers a user-friendly interface for designing surveys. Users can create surveys with various question types, including multiple choice, open-ended, and Likert scale questions.
- Customization: Researchers can customize the appearance of surveys with themes, logos, and branding to maintain a consistent look and feel.
- Advanced Features: SurveyMonkey provides advanced survey design features such as skip logic, randomization, and question branching, allowing researchers to create dynamic surveys.
- Distribution: Surveys can be distributed via email, social media, web links, or embedded in websites, providing flexibility in reaching respondents.
- Data Analysis: The platform offers basic data analysis tools, including summary statistics and data export options. Advanced reporting features are available in paid plans.
- Integration: SurveyMonkey integrates with various third-party applications, streamlining data transfer and analysis.
- User-friendly and suitable for both beginners and experienced users.
- Advanced survey design options for creating dynamic surveys.
- Customization options for branding and consistent design.
- Integration with other applications for data management.
- Trusted by academic researchers, businesses, and organizations.
- Access to advanced features, such as skip logic and custom themes, requires upgrading to paid plans.
- Advanced reporting and analysis features are available in paid plans.
SurveyMonkey is an accessible and versatile survey tool that is widely used by academic researchers for its user-friendly interface and range of features.
It’s well-suited for researchers conducting surveys with various complexities and customization needs, making it a popular choice in both academic and business settings.
5. Typeform
Typeform is an innovative and visually appealing online survey tool known for its interactive and engaging survey design.
It aims to provide a conversational experience for respondents and is used by a variety of users, including academic researchers, businesses, and creative professionals.

- Interactive Surveys: Typeform is recognized for creating visually engaging and interactive surveys that resemble conversations rather than traditional forms.
- Advanced Features: Researchers can implement logic branching, piping, and other advanced features to create dynamic and personalized surveys.
- Customization: Typeform allows for extensive customization and branding, enabling users to create surveys that align with their organization’s identity.
- Question Types: The platform supports various question types, including multiple choice, short text, long text, and rating scales.
- Integration: Typeform integrates with various third-party applications and services, facilitating data transfer and analysis.
- Data Analysis: Basic data analysis tools are available, and responses can be exported for further analysis.
- Engaging and interactive survey design, making it particularly appealing for creative and design-focused research projects.
- Advanced features like logic branching and piping for personalized surveys.
- Extensive customization options for branding and design.
- Integration with other applications for streamlined data management.
- Suitable for various research needs, including academic research.
- Access to advanced features and in-depth reporting requires a paid subscription.
Typeform is an excellent choice for researchers who prioritize creating visually engaging and interactive surveys.
Its modern and user-friendly interface makes it suitable for academic researchers looking to collect data in a more engaging and dynamic way, particularly for creative and design-related research projects.
6. LimeSurvey
LimeSurvey is an open-source survey software that provides users with extensive control over survey design, data collection, and analysis.
It is favored by open-source enthusiasts and researchers who seek complete customization and flexibility in their survey projects.

- Open Source: LimeSurvey is open-source software, allowing users to host it on their servers and have full control over the installation and configuration.
- Customization: Researchers can customize every aspect of their surveys, including design, question types, and survey flow, to meet specific research requirements.
- Question Variety: LimeSurvey supports a wide range of question types, including multiple choice, open-ended, ranking, and matrix questions.
- No Response Limitations: LimeSurvey does not impose limitations on the number of surveys or responses, making it suitable for large-scale research projects.
- Data Export: Survey data can be exported in various formats, enabling further analysis with external tools.
- Survey Logic: Logic branching and conditional survey flow can be implemented to ensure that respondents see relevant questions based on their previous answers.
- Complete control over survey design and hosting, making it ideal for tech-savvy researchers.
- No limitations on the number of surveys or responses, allowing for scalability.
- Extensive customization options, suitable for complex and specialized research projects.
- Supports various question types and survey logic for tailored surveys.
- No subscription fees or costs associated with hosting on your server.
- Hosting and server setup can be technically challenging for users without experience in server management.
- The user interface may not be as intuitive as some other survey tools.
- Limited user support compared to commercial survey tools.
LimeSurvey is an excellent choice for researchers who prioritize complete control and customization over their survey projects.
It is particularly well-suited for researchers with technical expertise who are comfortable hosting and configuring the software on their servers.
LimeSurvey’s flexibility and open-source nature make it an attractive option for academic researchers and organizations looking for tailored survey solutions.
7. SoGoSurvey (Now Sogolytics)
Sogolytics is an online survey software platform designed to assist users in creating, distributing, and analyzing surveys for various purposes, including academic research, employee feedback, and customer satisfaction.

- Advanced Features: Sogolytics offers advanced features such as skip logic, branching, and customizable survey templates, allowing researchers to create dynamic and tailored surveys.
- Customization: Researchers can customize survey templates and branding to match their research goals and maintain a consistent look and feel.
- Question Types: The platform supports multiple question types, including multiple choice, open-ended, and ranking questions.
- Unlimited Surveys: The free core version of Sogolytics allows an unlimited number of surveys, offering scalability.
- Data Export: Survey data can be exported in various formats for further analysis with external tools.
- Data Analysis: Basic reporting and analysis features are available, while more advanced reporting options are available in paid plans.
- Advanced features like skip logic and branching for personalized surveys.
- Customizable survey templates and branding options.
- Supports multiple question types to cater to various research needs.
- Offers an unlimited number of surveys in the free core version.
- Trusted by academic researchers and organizations for feedback and research projects.
- The free version has limitations, including response limitations and access to advanced reporting features.
- Access to advanced reporting and analysis features requires a subscription to paid plans.
Sogolytics is gaining recognition among researchers for its advanced features and customizable survey templates.
It is a viable choice for academics conducting both simple and complex research projects, particularly those looking for scalable survey solutions.
Researchers should consider their specific needs and budget when choosing between the free and paid versions of Sogolytics.
Selecting the right survey tool is a crucial decision for Ph.D. researchers. Your choice will significantly impact the efficiency of your research, the quality of your data, and your ability to derive meaningful insights.
Whether you opt for the advanced capabilities of tools like Qualtrics, Zoho Survey and SurveyMonkey, the visually appealing design of Typeform, the open-source flexibility of LimeSurvey, or the user-friendliness of Google Forms, each tool has its strengths and is suited to different research needs.
Ultimately, the best survey tool for your Ph.D. research depends on your research objectives, technical expertise, and budget.
Take the time to assess your specific requirements and choose a tool that empowers you to collect and analyze data effectively, contributing valuable insights to your field of study.
Top of Form
FAQs (Frequently Asked Questions)
Now that we’ve explored the best survey tools for Ph.D. research, let’s address some frequently asked questions that can help you make an informed decision:
Q1: Are these survey tools free?
Some of the mentioned survey tools offer free versions, while others have free trials or limited free plans.
The availability of free features and limitations can vary, so it’s essential to review each tool’s pricing and features.
Q2: Which tool is best for beginners?
Google Forms is often recommended for beginners due to its user-friendly interface and simplicity. If you’re new to survey research, starting with Google Forms can be a great way to get acquainted with the process.
Q3: What if I need advanced features?
If your research project requires advanced features like skip logic, branching, and in-depth reporting, consider tools like Qualtrics, SurveyMonkey, or Typeform, which offer robust options in their paid plans.
Q4: How can I choose the right tool for my research?
When choosing a survey tool, consider factors such as the complexity of your research design, the expected number of respondents, your familiarity with the platform, and your budget.
Additionally, consult with your advisor or peers for recommendations tailored to your specific research goals.
Q5: Can I change my survey tool later in my research project?
Yes, you can switch survey tools during your research project. However, this may involve transferring data and adjusting your survey design to fit the new tool’s capabilities.
It’s essential to plan such transitions carefully to minimize disruptions to your research.
Related Posts

5 Best Reference Management Software for Research [FREE]

11 Best Data Analysis Software for Research [2023]
Leave a comment cancel reply.
Your email address will not be published. Required fields are marked *
Save my name, email, and website in this browser for the next time I comment.

An official website of the United States government
The .gov means it’s official. Federal government websites often end in .gov or .mil. Before sharing sensitive information, make sure you’re on a federal government site.
The site is secure. The https:// ensures that you are connecting to the official website and that any information you provide is encrypted and transmitted securely.
- Publications
- Account settings
Preview improvements coming to the PMC website in October 2024. Learn More or Try it out now .
- Advanced Search
- Journal List
- Elsevier - PMC COVID-19 Collection
A critical look at online survey or questionnaire-based research studies during COVID-19
In view of restrictions imposed to control COVID-19 pandemic, there has been a surge in online survey-based studies because of its ability to collect data with greater ease and faster speed compared to traditional methods. However, there are important concerns about the validity and generalizability of findings obtained using the online survey methodology. Further, there are data privacy concerns and ethical issues unique to these studies due to the electronic and online nature of survey data. Here, we describe some of the important issues associated with poor scientific quality of online survey findings, and provide suggestions to address them in future studies going ahead.
1. Introduction
Online survey or questionnaire-based studies collect information from participants responding to the study link using internet-based communication technology (e.g. E-mail, online survey platform). There has been a growing interest among researchers for using internet-based data collection methods during the COVID-19 pandemic, also reflected in the rising number studies employing online survey to collect data since the beginning of COVID-19 pandemic ( Akintunde et al., 2021 ). This could be due to the relative ease of online data collection over traditional face-to-face interviews while following the travel restrictions and distancing guidelines for controlling the spread of COVID-19 pandemic. Further, it offers a cost-effective and faster way of data collection (with no interviewer requirement and automatic data entry) as compared to other means of remote data collection (e.g. telephonic interview) ( Hlatshwako et al., 2021 ), both of which are important for getting rapid results to guide development and implementation public-health interventions for preventing and/or mitigating the harms related to COVID-19 pandemic (e.g. mental health effects of COVID-19, misconceptions related to spread of COVID-19, factors affecting vaccine hesitancy etc.). However, there have been several concerns raised about the validity and generalizability of findings obtained from online survey studies ( Andrade et al., 2020 ; Sagar et al., 2020 ). Here, we describe some of the important issues associated with scientific quality of online survey findings, and provide suggestions to address them in future studies going ahead. The data privacy concerns and ethical issues unique to these studies due to the electronic and online nature survey data have also briefly discussed.
2. Limited generalizability of online survey sample to the target general population
The findings obtained from online surveys need to be generalized to the target population in the real world. For this, the online survey population needs to be clearly defined and should be representative of the target population as much as possible. This would be possible when there is reliable sampling frame for online surveys, and participants could be selected using randomized or probability sampling method. However, online surveys are often conducted via email or online survey platform, with survey link shared on social media platforms or websites or directory of email ids accessed by researchers. Also, participants might be asked to share the survey link further with their eligible contacts. In turn, the population from which the study sample is selected often not clearly defined, and information about response rates (i.e. out of the total number people who viewed the survey link, how many of them did actually respond) are seldom available with the researcher. This makes generalization of study findings unreliable.
This problem may be addressed by sending survey link individually to all the people comprising the study population via email and/ or telephonic message (e.g. all the members of a professional society through membership directory, people residing in a society through official records etc.), with a request not to share the survey link with anyone else. Alternatively, required number of people could be randomly selected from the entire list of potential subjects and approached telephonically for taking consent. Basic socio-demographic details could be obtained from those who refused to participate and share the survey link with those agreeing to participate. Although, if the response rates are low or the socio-demographic details of non-responders significantly differ from that of responders, then the online survey sample is unlikely to be representative of the target study population. Further, this is a more resource intensive strategy and might not be always feasible (as it requires a list of contact details for the entire study population prior to beginning of data collection). In certain situations, when the area of research is relatively new and/or needs urgent exploration for hypothesis generation or guiding immediate response; the online survey study should list all possible attempts made to achieve a representative sample and clearly acknowledge it as a limitation while discussing their study findings ( Zhou et al., 2021 ).
A more recent innovative solution to this problem involves partnership between academic institutions (Maryland University and Carnegie Mellon University) and the Facebook company for conducting online COVID-19 related research ( Barkay et al., 2020 ). The COVID-19 Symptom Survey (CSS) conducted (in more than 200 countries since April 2020) using this approach involves exchange of information between the researchers and the Facebook without compromising the data privacy of information collected from survey participants. The survey link is shared on the Facebook, and user voluntary choose to participate in the study. The Facebook’s active user base is leveraged to provide a reliable sampling frame for the CSS survey. The researchers select random ID numbers for the users who completed the survey, and calculate survey weights for each them on a given day. Survey weights adjust for both non-response errors (helps in making them sample more representative of the Facebook users) and coverage related errors (helps in making generalizing findings obtained using FAUB to the general population) ( Barkay et al., 2020 ). A respondent belonging to a demographic group with a high likelihood of responding to the survey might get a weight of 10, whereas another respondent belonging to a demographic group with less likelihood of responding to survey might get a weight of 50. It also accounts for the proportion or density of Facebook or internet users in a given geographical area. Thus, findings obtained using this approach could be used for drawing inferences about the target general population. The survey weights to be used for weighted analysis of global CSS survey findings for different geographical regions are available to researchers upon request from either of the two above-mentioned academic institutions. For example, spatio-temporal trends in COVID-19 vaccine related hesitancy across different states of India was estimated by a group of Indian researchers using this approach ( Chowdhury et al., 2021 ).
3. Survey fraud and participant disinterest
Survey fraud is when a person takes the online survey more than once with or without any malicious intent (e.g. monetary compensation, helping researchers collect the requisite number of responses). Another related problem is when the participant responds to some or all the survey questions in a casual manner without actually making any attempt at reading and/or understanding them due to reasons like participant disinterest or survey fatigue. This affects the representativeness and validity of online survey findings, and is increasingly being recognized as an important challenge for researchers ( Chandler et al., 2020 ). While providing monetary incentives improves low response rates, it also increases the risk of survey fraud. Similarly, having a shorter survey length with few simple questions decreases the chances of survey fatigue, but limits the ability of researchers to obtain meaningful information about relatively complex issues. A researcher can take different approaches to address these concerns, ranging from relatively simpler ones such as requesting people to not participate more than once, providing different kind of monetary incentives (e.g. donation to a charity instead of the participant), or manually checking survey responses for inconsistent (e.g. age and date of birth responses not consistent) or implausible response patterns (e.g. average daily smartphone use of greater than 24 h, “all or none” response pattern) to more complex ones involving use of computer software or online survey platform features to block multiple entries by same person using IP address and/or internet cookies check, analysis of response time, latency or total time taken to complete survey for detecting fraudulent responses. There have been several different ways described in the available literature to detect fraudulent or inattentive survey responses, with a discussion about merits and demerits of each of them ( Teitcher et al., 2015 ). However, no single method is completely fool proof, and it is recommended to use a combination of different methods to ensure adequate data quality in online surveys.
4. Possible bias introduced in results by the online survey administration mode
One of the contributory reasons for surge in online survey studies assessing mental health related aspects during the COVID-19 pandemic stems from the general thought that psychiatry research could be easily accomplished through scales or questionnaires administered through online survey methods, especially with the reliance on physical examination and other investigation findings being much less or non-existent. However, the reliability and validity of the scales or instruments used in online surveys have been traditionally established in studies administering them in face-to-face settings (often in pen/pencil-paper format) rather than online mode. There could be variation introduced in the results with different survey administration modes, which is often described as the measurement effect ( Jäckle et al., 2010 ). This could be due to differences in the participants’ level of engagement, understanding of questions, social desirability bias experienced across different survey administration methods. Few studies using the same study sample or sample sampling frame have compared the results obtained with difference in survey administration mode (ie. traditional face-to-face [paper format] vs. online survey), with mixed findings suggesting large significant differences to small significant difference or no significant differences ( Determann et al., 2017 , Norman et al., 2010 , Saloniki et al., 2019 ). This suggests the need for conducting further studies before arriving at a final conclusion. Hence, we need to be careful while interpreting the results of online survey studies. Ideally, online survey findings should be compared with those obtained using traditional survey administration mode, and validation studies should be conducted to establish the psychometric properties of these scales for online survey mode.
5. Inadequately described online survey methodology
A recent systematic review assessing the quality of 80 online survey based published studies assessing the mental health impact of COVID-19 pandemic, reported that a large majority of them did not adhere to the CHERRIES (Checklist for Reporting Results of Internet E-Surveys) guideline aimed at improving the quality of online surveys ( Eysenbach, 2004 , Sharma et al., 2021 ). Information related to parameters such as view rate (Ratio of unique survey visitors/unique site visitors), participation rate (Ratio of unique visitors who agreed to participate/unique first survey page visitors), and completion rate (Ratio of users who finished the survey/users who agreed to participate); which gives an idea about the representativeness of the online study sample as described previously were not mentioned in about two-third studies. Similarly, information about steps taken to prevent multiple entries by same participant or analysis of atypical timestamps to check for fraudulent and inattentive survey responses was provided by less than 5% studies. Thus, it is imperative to popularize and emphasize upon the use of these reporting guidelines for online survey studies to improve the scientific value of findings obtained from internet-based studies.
6. Data privacy and ethics of online survey studies
Lastly, most of the online survey studies either did not mention at all or mentioned in passing about maintain the anonymity and confidentiality of information obtained from online survey. However, details about the various steps or precautions taken by the researchers to ensure data safety and privacy were seldom mentioned (e.g. de-identified data, encryption process or password protected data storage, use of HIPAA-compliant online survey form/platform etc.). The details and limitations of safety steps taken, and the possibility of data leak should be clearly mentioned/ communicated to participants at the time of taking informed consent (rather than simply mentioning anonymity and confidentiality of information obtained will be ensured, as is the case with offline studies). Moreover, obtaining ethical approval prior to conducting online survey studies is a must. The various ethical concerns unique to online survey methodology (e.g. issues with data protection, informed consent process, survey fraud, online survey administration etc.) should be adequately described in the protocol and deliberated upon by the review boards ( Buchanan and Hvizdak, 2009 , Gupta, 2017 ).
In conclusion, there is an urgent need to consider the above described issues while planning and conducting an online survey, and also reviewing the findings obtained from these studies to improve the overall quality and utility of internet-based research during COVID-19 and post-COVID era.
Financial disclosure
The authors did not receive any funding for this work.
Acknowledgments
Conflict of interest.
The authors have no conflict of interest to declare.
- Akintunde T.Y., Musa T.H., Musa H.H., Musa I.H., Chen S., Ibrahim E., Tassang A.E., Helmy M. Bibliometric analysis of global scientific literature on effects of COVID-19 pandemic on mental health. Asian J. Psychiatry. 2021; 63 doi: 10.1016/j.ajp.2021.102753. [ PMC free article ] [ PubMed ] [ CrossRef ] [ Google Scholar ]
- Andrade C. The limitations of online surveys. Indian J. Psychol. Med. 2020; 42 (6):575–576. doi: 10.1177/0253717620957496. [ PMC free article ] [ PubMed ] [ CrossRef ] [ Google Scholar ]
- Barkay, N., Cobb, C., Eilat, R., Galili, T., Haimovich, D., LaRocca, S., ..., Sarig, T., 2020. Weights and methodology brief for the COVID-19 symptom survey by University of Maryland and Carnegie Mellon University, in partnership with Facebook, arXiv preprint arXiv:2009.14675.
- Buchanan E.A., Hvizdak E.E. Online survey tools: ethical and methodological concerns of human research ethics committees. J. Empir. Res. Hum. Res. Ethics. 2009; 4 (2):37–48. doi: 10.1525/jer.2009.4.2.37. [ PubMed ] [ CrossRef ] [ Google Scholar ]
- Chandler J., Sisso I., Shapiro D. Participant carelessness and fraud: consequences for clinical research and potential solutions. J. Abnorm. Psychol. 2020; 129 (1):49–55. doi: 10.1037/abn0000479. [ PubMed ] [ CrossRef ] [ Google Scholar ]
- Chowdhury, S.R., Motheram, A., Pramanik, S., 2021. Covid-19 vaccine hesitancy: trends across states, over time. Ideas For India, 14 April, Available from: 〈https://www.ideasforindia.in/topics/governance/covid-19-vaccine-hesitancy-trends-across-states-over-time.html%20%20〉 (Accessed 4 August 2021).
- Determann D., Lambooij M.S., Steyerberg E.W., de Bekker-Grob E.W., de Wit G.A. Impact of survey administration mode on the results of a health-related discrete choice experiment: online and paper comparison. Value Health.: J. Int. Soc. Pharm. Outcomes Res. 2017; 20 (7):953–960. doi: 10.1016/j.jval.2017.02.007. [ PubMed ] [ CrossRef ] [ Google Scholar ]
- Eysenbach G. Improving the quality of web surveys: the Checklist for Reporting Results of Internet E-Surveys (CHERRIES) J. Med. Internet Res. 2004; 6 (3):34. doi: 10.2196/jmir.6.3.e34. [ PMC free article ] [ PubMed ] [ CrossRef ] [ Google Scholar ]
- Gupta S. Ethical issues in designing internet-based research: recommendations for good practice. J. Res. Pract. 2017; 13 (2) Article D1. [ Google Scholar ]
- Hlatshwako T.G., Shah S.J., Kosana P., Adebayo E., Hendriks J., Larsson E.C., Hensel D.J., Erausquin J.T., Marks M., Michielsen K., Saltis H., Francis J.M., Wouters E., Tucker J.D. Online health survey research during COVID-19. Lancet Digit. Health. 2021; 3 (2):e76–e77. doi: 10.1016/S2589-7500(21)00002-9. [ PMC free article ] [ PubMed ] [ CrossRef ] [ Google Scholar ]
- Jäckle A., Roberts C., Lynn P. Assessing the effect of data collection mode on measurement. Int. Stat. Rev. 2010; 78 (1):3–20. doi: 10.1111/j.1751-5823.2010.00102.x. [ CrossRef ] [ Google Scholar ]
- Norman R., King M.T., Clarke D., Viney R., Cronin P., Street D. Does mode of administration matter? Comparison of online and face-to-face administration of a time trade-off task. Qual. Life Res.: Int. J. Qual. Life Asp. Treat., Care Rehabil. 2010; 19 (4):499–508. doi: 10.1007/s11136-010-9609-5. [ PubMed ] [ CrossRef ] [ Google Scholar ]
- Sagar R., Chawla N., Sen M.S. Is it correct to estimate mental disorder through online surveys during COVID-19 pandemic? Psychiatry Res. 2020; 291 doi: 10.1016/j.psychres.2020.113251. [ PMC free article ] [ PubMed ] [ CrossRef ] [ Google Scholar ]
- Saloniki E.C., Malley J., Burge P., Lu H., Batchelder L., Linnosmaa I., Trukeschitz B., Forder J. Comparing internet and face-to-face surveys as methods for eliciting preferences for social care-related quality of life: evidence from England using the ASCOT service user measure. Qual. Life Res.: Int. J. Qual. Life Asp. Treat., Care Rehabil. 2019; 28 (8):2207–2220. doi: 10.1007/s11136-019-02172-2. [ PMC free article ] [ PubMed ] [ CrossRef ] [ Google Scholar ]
- Sharma R., Tikka S.K., Bhute A.R., Bastia B.K. Adherence of online surveys on mental health during the early part of the COVID-19 outbreak to standard reporting guidelines: a systematic review. Asian J. Psychiatry. 2021; 65 doi: 10.1016/j.ajp.2021.102799. (Advance online publication) [ PMC free article ] [ PubMed ] [ CrossRef ] [ Google Scholar ]
- Teitcher J.E., Bockting W.O., Bauermeister J.A., Hoefer C.J., Miner M.H., Klitzman R.L. Detecting, preventing, and responding to “fraudsters” in internet research: ethics and tradeoffs. J. Law, Med. Ethics: J. Am. Soc. Law, Med. Ethics. 2015; 43 (1):116–133. doi: 10.1111/jlme.12200. [ PMC free article ] [ PubMed ] [ CrossRef ] [ Google Scholar ]
- Zhou T., Chen W., Liu X., Wu T., Wen L., Yang X., Hou Z., Chen B., Zhang T., Zhang C., Xie C., Zhou X., Wang L., Hua J., Tang Q., Zhao M., Hong X., Liu W., Du C., Li Y., Yu X. Children of parents with mental illness in the COVID-19pandemic: a cross-sectional survey in China. Asian J. Psychiatry. 2021; 64 doi: 10.1016/j.ajp.2021.102801. (Advance online publication) [ PMC free article ] [ PubMed ] [ CrossRef ] [ Google Scholar ]
- Student Program
- Sign Up for Free

How to Create a Survey
6 best survey tools for research
Best survey tools for research.
- SurveyMonkey
- Google Forms
- Sogolytics (Formerly SoGoSurvey)
- Zoho Survey
Collecting data from a group of people can be a powerful way to gain insights about a target demographic. Whether you’re looking for feedback or need information about their interests, the right survey tools for research can help you gather and organize this data.
Research surveys are useful in a variety of settings: Students use these tools for academic purposes, and businesses often use surveys to ask for customer feedback .
Surveys let you connect with participants and get valuable data from them. You can then evaluate that data using tools like spreadsheets to develop deeper insights.
Survey features to look for
Using the right survey tools for research will streamline the data-collection process and optimize your overall results. When you’re choosing a survey tool, look for a solution that offers a variety of features, such as
- Predesigned templates. Templates mean you don’t have to start from scratch when creating new surveys. Find a template that includes the main features you need for each research project.
- Customization options. Whether you’re using a premade template or starting from scratch, you need the flexibility to customize each survey’s details.
- Survey logic. Built-in logic features ensure that respondents only see relevant questions. For example, a good survey tool will skip a question if a previous answer makes it irrelevant.
- Data analysis. Collecting the responses is just the first step. You also need an effective tool to review and analyze the data. There’s no reason to go through answers manually when a good survey tool can organize and sort information.
- Website integration. When the survey tool integrates with your website, it’s simple to share the link with participants. Look for a tool that allows you to embed the survey on your website or in email messages.
While each research project will have different requirements, finding the right survey tool is an essential step in ensuring your research efforts go smoothly. You’ll be able to adapt your surveys to meet each project’s unique specifications.
6 top-rated survey tools
Here’s a summary of the best survey tools for research that can help you find the insights you need.
Jotform’s Form Builder is easy to use, and our no-code survey building solutions are customizable and simple to integrate, even for customers with limited technical experience. In addition, responses feed into Jotform Tables for easy data analysis.
Notable features include a variety of themes and templates, app integrations, widget customization, and an intuitive drag-and-drop form editor. All features, except for HIPAA compliance, are available through the free Starter plan.
If you’d like to present the data from your survey, it’s easy to create a professional looking report using the Jotform Report Builder .
You can also build surveys with Jotform’s free online survey maker .
2. SurveyMonkey

One of the most widely known tools in the industry, this survey platform is popular for good reason. Similar to Jotform, SurveyMonkey offers a user-friendly admin area that requires no coding skills to build surveys. The free personal plan is appealing to many businesses, but the basic account limits certain features, such as data exporting.
If you’re looking to explore options beyond SurveyMonkey alternatives , our article offers an in-depth look at different survey tools and their capabilities.
3. Typeform

When you’re looking for versatility, Typeform is a great option to consider. This tool has a variety of options for building questionnaires, forms, and surveys. Not only does Typeform make it easy to develop a survey, but it also creates a great user experience for participants — and that can increase the overall completion rate of each survey.
Users need to subscribe to one of the paid plans to access the best features and a higher limit on the number of responses.
4. Google Forms

Google offers a cloud-based suite of office tools that are free to anyone with a Google account. Google Forms is popular because it provides unlimited surveys and responses without requiring you to go through a paywall to use all the features.
This tool provides many of the customization features available through other tools listed above, including skip logic, data analysis, and the option to embed the form into a website or email.
5. Sogolytics (Formerly SoGoSurvey)

This free survey tool includes comprehensive design features and in-depth analysis to gain insights from the responses you collect. With over 25 types of questions available to choose from, you’ll find it easy to customize each form based on your project’s needs.
Sogolytics is the preferred choice for small projects since the free version allows up to 200 responses annually. More extensive research projects will require a paid account so you can collect information from more respondents.
6. Zoho Survey

The basic Zoho Survey account provides everything you need to create a simple survey. If you want more customization options, then it’s helpful to have a paid version. Available features include email notifications, offline surveys, advanced reporting, and multilingual forms.
These survey tools for research make it simple to collect the information you need. Whether you are creating an online survey or you need custome r feedback , the right form design streamlines the process and provides valuable insights.
Thank you for helping improve the Jotform Blog. 🎉
RECOMMENDED ARTICLES

6 EmailMeForm alternatives to build powerful surveys

30 insightful hotel survey questions

How to embed a survey in an email

Top 14 demographic survey questions to ask

20 business survey questions to ask your customers

Survey report examples with informative visuals

8 types of poll questions to engage your online audience
")
How to write a survey introduction (plus examples)

How to measure customer experience: Key metrics and KPIs

How to analyze survey data

How to conduct a pricing survey: Questions to ask

20 psychology survey questions to ask your clients

Ethnicity survey questions: Benefits and examples

65+ e-commerce survey questions for valuable business insights

Top 6 QuestionPro alternatives

Exit survey questions to ask your former employees

Using survey logic to elicit better survey responses

How to ask someone to fill out a survey

Webinar: How to use surveys and email marketing to gain key insights

How to do a poll in Slack

10 questions to ask in your membership survey

Qualtrics vs SurveyMonkey: Which should you choose?

Top 9 Qualaroo alternatives

80 survey question examples and when to use them

Survey vs questionnaire: Which one should you use for your next project?

9 examples of ranking survey questions

What is a good survey response rate?

A Guide to Creating the Perfect Survey Form

29 best customer experience survey questions

How to create a survey in Google Forms

4 tips for creating effective quantitative surveys

What you need to know about SurveyMonkey pricing

The 3 best Checkbox Survey alternatives
 survey questions")
20 essential human resources (HR) survey questions

Social media survey questions: Examples and best practices
")
How to calculate the Net Promoter Score® (NPS®)

How to create an NPS® survey email that gets results

Qualitative vs quantitative questions: What you need to know

Survicate vs SurveyMonkey: Comparing online survey platforms

Pre-sales surveys: How to focus on your best leads

How to set up and send a Constant Contact survey

How to write a research question

20 religion survey questions to ask your church community

How to improve survey accuracy

Basic product survey questions to ask customers

Multiple-choice survey questions: Examples and tips

Top 3 SurveySparrow alternatives

What are the best website survey questions?

Closed-ended questions: Definition and examples

How to add a popup survey on your website

How to turn survey results into a great presentation

15 of the best Refiner.io alternatives

How to write a survey reminder email

How to write good survey questions

What is the smiley face rating scale?

How to add a “poor to excellent” scale to your surveys

Top 15 employee pulse survey tools

CRM survey benefits, best practices, and example questions

How many questions to include in an online survey

Best training survey questions to evaluate effectiveness

7 important user experience survey questions you should ask

4 survey design tips to get more accurate results

How to avoid survey fatigue

How to use a survey dashboard effectively

The best newsletter survey questions to ask

How to get the most out of Peakon surveys

Announcing Jotform’s free Student Survey Program

5 types of questionnaires

Top diversity and inclusion questions to ask employees

5 UX survey tools to help you create a winning user experience

Survey data collection: 5 best practices

4 types of survey questions to engage your audience

How to send surveys: 7 survey distribution methods

Top 21 brand survey questions

8 employee-of-the-month survey questions you should ask

SurveyLegend alternatives

The 4 survey data collection software you should start using today

How to create an employee pulse survey
")
SurveyMonkey vs Alchemer (Formerly SurveyGizmo)

8 of the best WordPress survey plug-ins

Yes-or-no questions in online forms and surveys

Types of survey bias and ways to avoid them

Top 5 Qualtrics alternatives

Top 7 KwikSurveys alternatives

10 AidaForm alternatives that make data collection a breeze

How to close a survey on SurveyMonkey

How is public opinion measured with surveys?

One question at a time: The best strategy for a survey

How to embed a survey in a website

Peakon alternatives

Real estate survey questions for buyers and sellers

5 ways to improve your online surveys

How to collect secure survey data

How to create a survey in Microsoft Word

11 top survey incentive ideas

Survey questions 101: Examples and tips

How to create a survey on Facebook

The 28 best post-purchase survey questions to ask your customers

Cybersecurity questionnaires: How to assess online threats
Send Comment :
Home » Blog » 10 Best Survey Software for Academic Research
10 Best Survey Software for Academic Research

Table of Contents
Are you doing academic research? Then you know that surveys are an essential part of the process. But what’s the best survey software for your needs? There are many options out there, and it can be tough to decide which is right for you.
This blog post will discuss the different types of survey software available and help you choose the right tool for your research project.
What Is Survey Software and What Are Its Uses for Academic Research Purposes?
A survey is a technique for acquiring data from a sample of people by asking pertinent questions to comprehend populations as a whole.
Survey software is a tool that allows researchers to collect data from a large number of respondents. Online survey software is a user-friendly platform that enables businesses to design surveys, gather responses, and quickly analyze data.
Data collected by the survey can then be analyzed to identify patterns and trends . Survey software can be used for various academic research purposes, such as investigating public opinion on a particular issue, tracking changes in attitudes over time, or studying the impact of a new policy.
In addition, survey data can be used to generate graphs and charts, which are used to illustrate findings in presentations and papers.
Question Pro

QuestionPro is an academic research survey software that allows users to collect data from multiple sources and analyze it in real time. It provides a platform for conducting surveys, collecting data, and analyzing results.
QuestionPro also offers a free plan for students and educators. This makes it an affordable option for those looking to conduct academic research on a budget.
Overall, QuestionPro is a powerful and easy-to-use tool that can help researchers collect reliable data.
- Ability to create custom questions, skip logic, and branching.
- Ability to send surveys via email or social media, track responses in real-time, and generate reports
- Researchers can customize the look and feel of their surveys to match their branding.
- Allows users to collect data from multiple sources. This includes online surveys, paper surveys, and mobile surveys.
- Provides real-time data analysis .
- The software does not offer a way to export data.
Pricing
- Offers a 14-day free trial
- Free plan available for students and educators.
- Standard plan: $19 per month
- Professional plan: starts at $99 per month
Survey Sparrow

The Survey Sparrow is a robust academic research tool that allows users to collect data from large groups of people quickly and easily.
Whether you’re conducting market research, collecting customer feedback, or polling employees on company morale, the Survey Sparrow is the perfect tool for the job.
- Survey Sparrow allows users to create surveys in multiple languages.
- It offers a range of question types that can be used to collect data on various topics.
- The software produces actionable results that are easy to interpret and use to improve research outcomes.
- Automatically formats results into tidy charts and graphs, making data analysis a breeze.
- It offers a free plan for small surveys of up to 50 responses.
- For more extensive surveys, pricing starts at $19 per month.
Survey Monkey

Survey Monkey is an academic research survey software that allows users to create, distribute, and analyze surveys. The software is web-based and offers a variety of features, including templates, question types, and skip logic.
Survey Monkey offers a free plan for small surveys and a paid plan for more extensive surveys. Academics and businesses use SurveyMonkey to collect data and insights from their target audience.
- Ability to send reminders and follow-up emails.
- Customize the look and feel of surveys and track responses in real time.
- The free plan is limited to 10 questions per survey and 100 responses per survey.
- Paid plans start at $26 per month.

SoGoSurvey is online survey software that allows users to quickly and easily create surveys, distribute them to respondents, and collect responses.
- Ability to create custom surveys, use pre-built templates, or import questions from existing surveys.
- Survey creators can also choose from various question types, including multiple-choice, rating scales, and open-ended questions.
- Response data can be exported into various formats for further analysis, and users can also share their surveys with collaborators or distribute them via social media.
- It offers a free plan for surveys with up to 100 responses.
- Paid plans start at $25/month for surveys with up to 1,000 responses.
SurveyLegend

SurveyLegend is online survey software that allows users to quickly and easily create beautiful surveys and collect responses.
- It offers various question types, including multiple-choice, rating scales, open-ended questions, and more.
- Response data can be exported into a variety of formats for further analysis.
- Users can share their surveys with collaborators or distribute them via social media.
- SurveyLegend also offers a mobile app for collecting survey responses on the go.
- Paid plans starting at $19/month for surveys with up to 1,000 responses.

Qualtrics is the gold standard when it comes to academic research survey software. Its user-friendly interface and customizable features make it a popular choice for researchers worldwide. Whether you’re conducting a small study or a large-scale research project, Qualtrics has the necessary parts to get the job done.
- Qualtrics offers a wide range of question types, making it a versatile tool for academic research.
- Qualtrics allows you to create custom surveys easily, and its built-in analysis tools make it easy to analyze your data.
- It offers powerful data mining and analysis capabilities, making drawing insights from large datasets easy.
- It provides a variety of question types, including multiple-choice, Likert scale, and open-ended questions.
- Qualtrics for an academic quote pricing starts at $1,000/year.
Qualaroo

Qualaroo is a robust academic research tool that allows you to collect and analyze data from your respondents. With Qualaroo, you can create surveys and questionnaires and then distribute them to your target audience.
The software also makes it easy to analyze the results of your surveys, providing valuable insights into your academic research.
It offers several integrations with popular academic research platforms, such as Mendeley and EndNote. As a result, it is easy to use Qualaroo in conjunction with other software applications to streamline the educational research process.
Best of all, Qualaroo is free to use for academic research purposes. So if you’re looking for a way to collect and analyze data from your respondents, Qualaroo is the perfect tool for the job.
- A built-in chat function that allows users to communicate with each other in real-time.
- Powerful tracking capabilities
- Ability to target specific groups of respondents.
- Qualaroo is free to use for academic research purposes.

WPForms is the perfect solution for creating surveys and collecting data for academic researchers. With its easy-to-use interface and powerful features, WPForms makes it easy to create forms and gather responses from all participants.
You can also use WPForms to create quizzes , polls, and other types of academic research instruments. And because WPForms is integrated with WordPress, you can easily manage your form submissions and view your results from your WordPress dashboard.
- WPForms offers an intuitive drag-and-drop builder that makes it easy to create custom forms.
- The platform includes a wide range of form fields and templates, so you can easily collect the data you need.
- You can use WPForms to connect with popular academic research tools, such as Qualtrics and SurveyMonkey.
- The free plan includes basic features and forms templates.
- Paid plans start at $39.50 per year (billed annually) and include access to additional features, such as surveys, polls, and quizzes.
Proprofs Survey

ProProfs Survey Maker is an academic research powerhouse. Its educational research aims to simplify the process of creating, administering, and analyzing surveys.
- Templates for standard survey designs include structured interviews, focus groups, and online surveys.
- The software includes tools for creating online surveys, managing respondents, and analyzing data.
- Provides detailed reports that show how respondents have answered questions.
- The Academic research plan starts at $19 per month.
Google forms

Google form is a popular choice for academic research as it is free to use and easy to set up. However, it lacks features that other paid survey software have, such as the ability to randomize questions or add images.
How to Select the Right Survey Software for Your Specific Needs
Before you can determine which survey software best suits your specific needs, you’ll need to understand what those needs are. To do that, ask yourself the following questions:
- How many people will be taking the survey?
- Are the respondents located in one geographical area or spread out?
- Do you need to collect data in real time, or can it be collected over time?
- What type of data do you need to collect?
- Do you need to track responses over time?
Once you understand your needs, you can look at different survey software options. There are various choices available, so it’s essential to take the time to compare features and prices.
Be sure to read online reviews from other users to get an idea of how easy the software is to use and whether or not it offers the features you need. With a bit of research, you should be able to find the perfect survey software for your specific needs.
Benefits of Using Survey Software for Academic Research Projects
There are many reasons why academics should use survey software for their research projects.
- First, surveys provide a quick and easy way to collect data from many people. It is beneficial for projects that require data from a wide geographical area or people with different opinions.
- Second, surveys can be easily customized to collect the specific data needed for the project. This allows academics to design their surveys to maximize their chances of getting the necessary information.
- Third, survey software makes it easy to analyze and interpret the collected data. It is essential for any research project that aims to produce actionable results.
- Finally, survey software is relatively affordable, making it an excellent option for researchers on a budget.
Overall, survey software provides a powerful tool for academics who want to collect high-quality data for their research projects.
FAQs on Academic Research Survey Software
Qualtrics , SurveyMonkey , and ZonkaFeedback are all popular academic research survey software options. It depends on your needs and preferences regarding which is best for you.
If you’re looking for a faster and easier way to get the data you need, QuestionPro is the perfect solution. With an easy-to-use interface, you can create a survey in minutes and get the data you need to make informed decisions. Plus, a drag-and-drop question builder makes it easy to create informative and engaging questions for your respondents.
There is no one-size-fits-all answer to this question, as the cost of academic research survey software can vary depending on several factors, including the specific features and functionality required, the number of users, and the level of support needed. However, as a general guide, academic research survey software typically costs between $500 and $3,000 per year.
So, what’s the best survey software for academic research? The answer depends on your needs and preferences and the research you’re conducting.
Qualtrics is popular among researchers as it offers many features and capabilities, including unlimited question types (e.g., Likert, multiple choice, open-ended, etc.) and question randomization.
However, if you’re seeking advanced features such as logic branching and piping, QuestionPro is an excellent option.
We hope this article has given you a better overview of some of the most popular survey tools and that you can now decide which one is right for you.

View all posts
With our platform, you have the opportunity to earn money by writing high-quality blog posts that resonate with our audience.
Sign up today and start earning money for your writing.

Read More Blogs

Benefits of Having Location Services Turned On
Turning on location services unlocks a world of benefits! Explore how this simple setting enhances convenience,…

Benefits of Location Intelligence in Supply Chain…
Discover how leveraging spatial data enhances efficiency and decision-making, revolutionizing how businesses optimize their logistical operations.

What is a Location-Aware Application?
Location-aware applications are changing the way we interact with technology. Discover the innovation and convenience they…
Guides & Tips
- Privacy Policy
- Compare Products
Copyright © 2023. All rights reserved.
Have a language expert improve your writing
Run a free plagiarism check in 10 minutes, generate accurate citations for free.
- Knowledge Base
Methodology
- Survey Research | Definition, Examples & Methods
Survey Research | Definition, Examples & Methods
Published on August 20, 2019 by Shona McCombes . Revised on June 22, 2023.
Survey research means collecting information about a group of people by asking them questions and analyzing the results. To conduct an effective survey, follow these six steps:
- Determine who will participate in the survey
- Decide the type of survey (mail, online, or in-person)
- Design the survey questions and layout
- Distribute the survey
- Analyze the responses
- Write up the results
Surveys are a flexible method of data collection that can be used in many different types of research .
Table of contents
What are surveys used for, step 1: define the population and sample, step 2: decide on the type of survey, step 3: design the survey questions, step 4: distribute the survey and collect responses, step 5: analyze the survey results, step 6: write up the survey results, other interesting articles, frequently asked questions about surveys.
Surveys are used as a method of gathering data in many different fields. They are a good choice when you want to find out about the characteristics, preferences, opinions, or beliefs of a group of people.
Common uses of survey research include:
- Social research : investigating the experiences and characteristics of different social groups
- Market research : finding out what customers think about products, services, and companies
- Health research : collecting data from patients about symptoms and treatments
- Politics : measuring public opinion about parties and policies
- Psychology : researching personality traits, preferences and behaviours
Surveys can be used in both cross-sectional studies , where you collect data just once, and in longitudinal studies , where you survey the same sample several times over an extended period.
Prevent plagiarism. Run a free check.
Before you start conducting survey research, you should already have a clear research question that defines what you want to find out. Based on this question, you need to determine exactly who you will target to participate in the survey.
Populations
The target population is the specific group of people that you want to find out about. This group can be very broad or relatively narrow. For example:
- The population of Brazil
- US college students
- Second-generation immigrants in the Netherlands
- Customers of a specific company aged 18-24
- British transgender women over the age of 50
Your survey should aim to produce results that can be generalized to the whole population. That means you need to carefully define exactly who you want to draw conclusions about.
Several common research biases can arise if your survey is not generalizable, particularly sampling bias and selection bias . The presence of these biases have serious repercussions for the validity of your results.
It’s rarely possible to survey the entire population of your research – it would be very difficult to get a response from every person in Brazil or every college student in the US. Instead, you will usually survey a sample from the population.
The sample size depends on how big the population is. You can use an online sample calculator to work out how many responses you need.
There are many sampling methods that allow you to generalize to broad populations. In general, though, the sample should aim to be representative of the population as a whole. The larger and more representative your sample, the more valid your conclusions. Again, beware of various types of sampling bias as you design your sample, particularly self-selection bias , nonresponse bias , undercoverage bias , and survivorship bias .
There are two main types of survey:
- A questionnaire , where a list of questions is distributed by mail, online or in person, and respondents fill it out themselves.
- An interview , where the researcher asks a set of questions by phone or in person and records the responses.
Which type you choose depends on the sample size and location, as well as the focus of the research.
Questionnaires
Sending out a paper survey by mail is a common method of gathering demographic information (for example, in a government census of the population).
- You can easily access a large sample.
- You have some control over who is included in the sample (e.g. residents of a specific region).
- The response rate is often low, and at risk for biases like self-selection bias .
Online surveys are a popular choice for students doing dissertation research , due to the low cost and flexibility of this method. There are many online tools available for constructing surveys, such as SurveyMonkey and Google Forms .
- You can quickly access a large sample without constraints on time or location.
- The data is easy to process and analyze.
- The anonymity and accessibility of online surveys mean you have less control over who responds, which can lead to biases like self-selection bias .
If your research focuses on a specific location, you can distribute a written questionnaire to be completed by respondents on the spot. For example, you could approach the customers of a shopping mall or ask all students to complete a questionnaire at the end of a class.
- You can screen respondents to make sure only people in the target population are included in the sample.
- You can collect time- and location-specific data (e.g. the opinions of a store’s weekday customers).
- The sample size will be smaller, so this method is less suitable for collecting data on broad populations and is at risk for sampling bias .
Oral interviews are a useful method for smaller sample sizes. They allow you to gather more in-depth information on people’s opinions and preferences. You can conduct interviews by phone or in person.
- You have personal contact with respondents, so you know exactly who will be included in the sample in advance.
- You can clarify questions and ask for follow-up information when necessary.
- The lack of anonymity may cause respondents to answer less honestly, and there is more risk of researcher bias.
Like questionnaires, interviews can be used to collect quantitative data: the researcher records each response as a category or rating and statistically analyzes the results. But they are more commonly used to collect qualitative data : the interviewees’ full responses are transcribed and analyzed individually to gain a richer understanding of their opinions and feelings.
Next, you need to decide which questions you will ask and how you will ask them. It’s important to consider:
- The type of questions
- The content of the questions
- The phrasing of the questions
- The ordering and layout of the survey
Open-ended vs closed-ended questions
There are two main forms of survey questions: open-ended and closed-ended. Many surveys use a combination of both.
Closed-ended questions give the respondent a predetermined set of answers to choose from. A closed-ended question can include:
- A binary answer (e.g. yes/no or agree/disagree )
- A scale (e.g. a Likert scale with five points ranging from strongly agree to strongly disagree )
- A list of options with a single answer possible (e.g. age categories)
- A list of options with multiple answers possible (e.g. leisure interests)
Closed-ended questions are best for quantitative research . They provide you with numerical data that can be statistically analyzed to find patterns, trends, and correlations .
Open-ended questions are best for qualitative research. This type of question has no predetermined answers to choose from. Instead, the respondent answers in their own words.
Open questions are most common in interviews, but you can also use them in questionnaires. They are often useful as follow-up questions to ask for more detailed explanations of responses to the closed questions.
The content of the survey questions
To ensure the validity and reliability of your results, you need to carefully consider each question in the survey. All questions should be narrowly focused with enough context for the respondent to answer accurately. Avoid questions that are not directly relevant to the survey’s purpose.
When constructing closed-ended questions, ensure that the options cover all possibilities. If you include a list of options that isn’t exhaustive, you can add an “other” field.
Phrasing the survey questions
In terms of language, the survey questions should be as clear and precise as possible. Tailor the questions to your target population, keeping in mind their level of knowledge of the topic. Avoid jargon or industry-specific terminology.
Survey questions are at risk for biases like social desirability bias , the Hawthorne effect , or demand characteristics . It’s critical to use language that respondents will easily understand, and avoid words with vague or ambiguous meanings. Make sure your questions are phrased neutrally, with no indication that you’d prefer a particular answer or emotion.
Ordering the survey questions
The questions should be arranged in a logical order. Start with easy, non-sensitive, closed-ended questions that will encourage the respondent to continue.
If the survey covers several different topics or themes, group together related questions. You can divide a questionnaire into sections to help respondents understand what is being asked in each part.
If a question refers back to or depends on the answer to a previous question, they should be placed directly next to one another.
Receive feedback on language, structure, and formatting
Professional editors proofread and edit your paper by focusing on:
- Academic style
- Vague sentences
- Style consistency
See an example

Before you start, create a clear plan for where, when, how, and with whom you will conduct the survey. Determine in advance how many responses you require and how you will gain access to the sample.
When you are satisfied that you have created a strong research design suitable for answering your research questions, you can conduct the survey through your method of choice – by mail, online, or in person.
There are many methods of analyzing the results of your survey. First you have to process the data, usually with the help of a computer program to sort all the responses. You should also clean the data by removing incomplete or incorrectly completed responses.
If you asked open-ended questions, you will have to code the responses by assigning labels to each response and organizing them into categories or themes. You can also use more qualitative methods, such as thematic analysis , which is especially suitable for analyzing interviews.
Statistical analysis is usually conducted using programs like SPSS or Stata. The same set of survey data can be subject to many analyses.
Finally, when you have collected and analyzed all the necessary data, you will write it up as part of your thesis, dissertation , or research paper .
In the methodology section, you describe exactly how you conducted the survey. You should explain the types of questions you used, the sampling method, when and where the survey took place, and the response rate. You can include the full questionnaire as an appendix and refer to it in the text if relevant.
Then introduce the analysis by describing how you prepared the data and the statistical methods you used to analyze it. In the results section, you summarize the key results from your analysis.
In the discussion and conclusion , you give your explanations and interpretations of these results, answer your research question, and reflect on the implications and limitations of the research.
If you want to know more about statistics , methodology , or research bias , make sure to check out some of our other articles with explanations and examples.
- Student’s t -distribution
- Normal distribution
- Null and Alternative Hypotheses
- Chi square tests
- Confidence interval
- Quartiles & Quantiles
- Cluster sampling
- Stratified sampling
- Data cleansing
- Reproducibility vs Replicability
- Peer review
- Prospective cohort study
Research bias
- Implicit bias
- Cognitive bias
- Placebo effect
- Hawthorne effect
- Hindsight bias
- Affect heuristic
- Social desirability bias
A questionnaire is a data collection tool or instrument, while a survey is an overarching research method that involves collecting and analyzing data from people using questionnaires.
A Likert scale is a rating scale that quantitatively assesses opinions, attitudes, or behaviors. It is made up of 4 or more questions that measure a single attitude or trait when response scores are combined.
To use a Likert scale in a survey , you present participants with Likert-type questions or statements, and a continuum of items, usually with 5 or 7 possible responses, to capture their degree of agreement.
Individual Likert-type questions are generally considered ordinal data , because the items have clear rank order, but don’t have an even distribution.
Overall Likert scale scores are sometimes treated as interval data. These scores are considered to have directionality and even spacing between them.
The type of data determines what statistical tests you should use to analyze your data.
The priorities of a research design can vary depending on the field, but you usually have to specify:
- Your research questions and/or hypotheses
- Your overall approach (e.g., qualitative or quantitative )
- The type of design you’re using (e.g., a survey , experiment , or case study )
- Your sampling methods or criteria for selecting subjects
- Your data collection methods (e.g., questionnaires , observations)
- Your data collection procedures (e.g., operationalization , timing and data management)
- Your data analysis methods (e.g., statistical tests or thematic analysis )
Cite this Scribbr article
If you want to cite this source, you can copy and paste the citation or click the “Cite this Scribbr article” button to automatically add the citation to our free Citation Generator.
McCombes, S. (2023, June 22). Survey Research | Definition, Examples & Methods. Scribbr. Retrieved March 25, 2024, from https://www.scribbr.com/methodology/survey-research/
Is this article helpful?

Shona McCombes
Other students also liked, qualitative vs. quantitative research | differences, examples & methods, questionnaire design | methods, question types & examples, what is a likert scale | guide & examples, "i thought ai proofreading was useless but..".
I've been using Scribbr for years now and I know it's a service that won't disappoint. It does a good job spotting mistakes”
- (855) 776-7763
Training Maker
All Products
Qualaroo Insights
ProProfs.com
- Sign Up Free
Do you want a free Survey Software?
We have the #1 Online Survey Maker Software to get actionable user insights.
10 Best Academic Survey Software for 2024

The field of education is an ever-evolving one, and surveys are crucial to examine theoretical findings with real-world data, which is prone to changing rather capriciously.
Generally speaking, academic surveys need far more precision and in-depth analytics to achieve the desired accuracy.
Owing to that, it’s absolutely necessary that you select an online survey software that is fully capable of conducting in-depth surveys, is user-friendly, has robust, detailed analytics, and seamlessly integrates with external apps such as Excel, Google Sheets, Tableau, etc., for processing the information obtained from surveys better.
Truth be told, the market is inundated with hundreds of such tools, all claiming to be the best. How do you know what really is the best, or even more importantly, suits your requirements?
I’ve done the legwork for you and compiled a list of the 12 top academic survey software options for 2023. I have meticulously evaluated these tools based on my experience of using them, trusted reviews, and peer recommendations.
A sneak peek into the tools I’ll be covering:
List of the Top 10 Academic Survey Software for 2024
The tools in this list have been chosen based on their feature-richness, user-friendliness, data analysis capabilities, and versatility. I’ve also included their descriptions, features, cons, and pricing to give you as complete an idea of their functionalities as possible.
1. ProProfs Survey Maker – Best for comprehensive survey experience
Watch: How to Create a Survey Using ProProfs Survey Maker
Having used ProProfs Survey Maker extensively, I can confidently say that the tool has features that can greatly enhance your survey research in an academic setting.
Let’s take its vast library of 100,000 ready-to-use survey questions . This is particularly useful for academic surveys as it saves valuable time and effort in creating and formulating survey questions from scratch.
You can also choose from a wide range of question types, including multiple-choice, ratings, and open-ended questions, allowing you to gather diverse and detailed responses for your research.
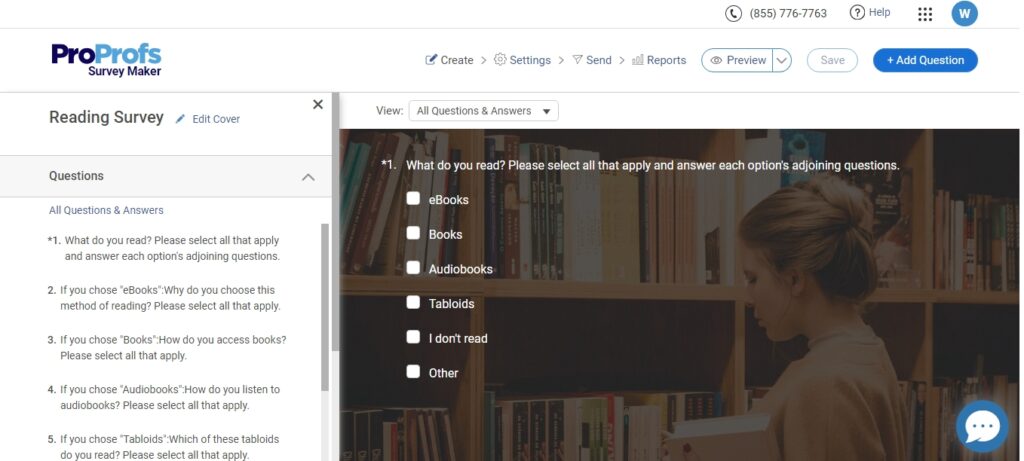
ProProfs Survey supports skip logic and branching. This enables researchers to tailor the survey experience based on respondents’ answers, making the surveys more targeted and focused on data collection.
Adding to it, ProProfs Survey has quite advanced reporting and analytics capabilities. It allows you to analyze and interpret your survey data effectively and generate results in a presentation-ready format, making it easier to communicate your findings to academic peers or supervisors.
The amalgamation of these features is what makes Survey Maker an invaluable tool for researchers, students, and academic institutions alike.
What you’ll like:
- A vast library of 100+ professionally designed templates for a quick start
- Ready-to-use questions for different survey types to save time in finding the right questions to ask
- Customization options to implement consistent branding guidelines with logo, colors, themes, and graphics
- Advanced reports and analytics to see who took your survey and when, how they answered, and more
- Integration with CRM and marketing automation software to follow up with your respondents easily
- Smart triggers to allow a survey to pop up after a certain time limit, percentage of page scrolled, or right before the exit
- Option to embed sidebar feedback forms at strategic points to capture unsolicited feedback
What you may not like:
- The templates could have been more refined to make them industry-specific
- The basic plan is limited to just one administrator
Starts at $19 per month. Unlimited surveys.
Read More: How to Analyze Survey Data Like a Pro
2. Qualaroo – Best for contextual feedback
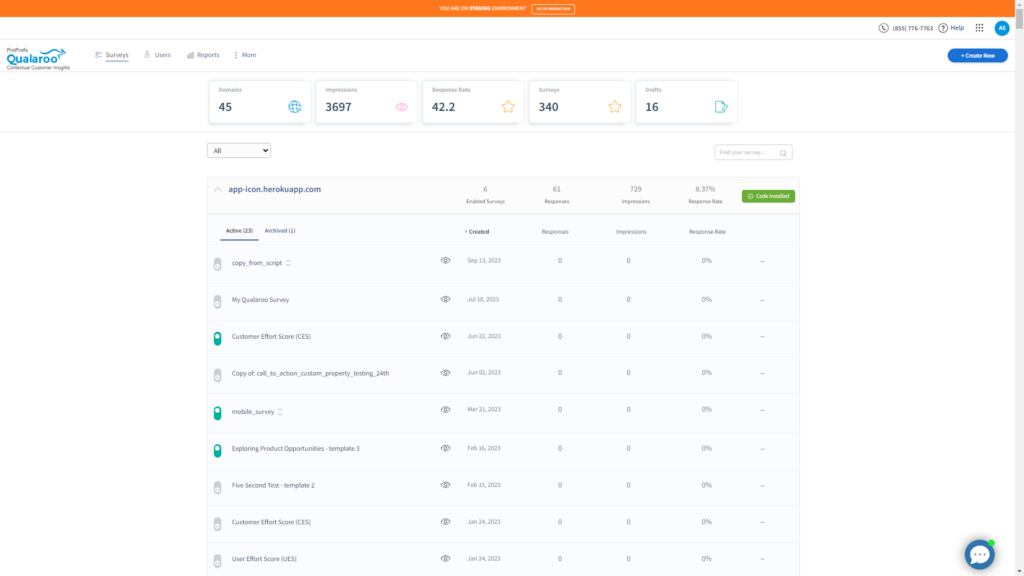
Qualaroo is noted for its ability to capture user sentiment right as they navigate a website.
This tool has an innovative technology, “ Nudge ,” that enables users to ask relevant questions at the right moment, without coming across as intrusive.
The feature makes it an excellent candidate for being one of the top academic survey tools, as you can subtly gather contextual data at an opportune moment rather than conducting the survey later.
One of the key advantages of this platform is its ability to display targeted surveys to the appropriate audience at the right time and in the relevant context.
The feedback analytics software not only provides businesses with valuable insights into their customers, but it also offers a user-friendly interface and robust features that are essential for any organization looking to enhance customer experience and increase conversions.
- Advanced targeting options, so you can zero in on the right audience
- Offers several question types like the Likert scale, dichotomous, rating scale, and more
- The ability to collect customer insights without disrupting their experience
- Exit intent surveys to gather feedback from leaving customers
- Powerful integrations with tools like Salesforce, HubSpot, Zapier, and MailChimp.
- The reporting can be made more flexible in terms of sorting, filtering, and segmenting feedback
- There is no option for light and dark modes in the application
Starts at $69/month
Watch: How to Create a Customer Satisfaction Survey
3. Zoho Survey – Best for bringing versatility in surveys
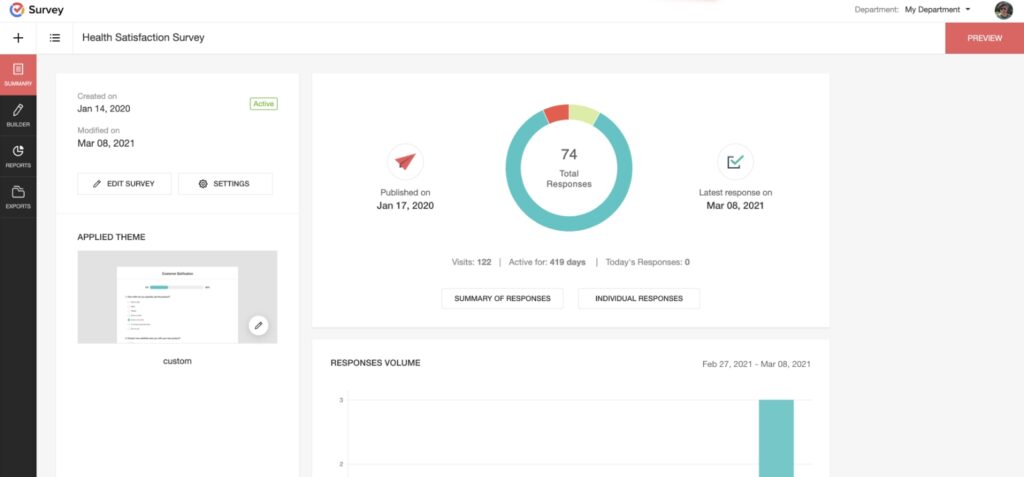
Zoho Survey is a versatile survey tool that can be extremely efficient if used in an academic setting.
You can use Zoho Survey not only to gather feedback from students, but also to keep track of attendance, administer quizzes, and conduct research surveys.
With its customizable templates, you can easily create surveys for a variety of purposes, such as teacher feedback, parent surveys, student satisfaction surveys, campus facilities feedback surveys, and bullying surveys.
One added perk of this tool is, students can use Zoho Survey’s Plus plan for free or any higher plan at a 50% discount, while educators can upgrade to any plan at a 50% discount. This makes it a more affordable solution for universities and individuals operating with limited budgets.
- Ability to create surveys easily with drag and drop, logic, and preview features
- 200+ templates for various types of surveys that you can edit or create your own
- Integrates with Zoho CRM to help you manage and analyze the data you collect from your surveys.
- Strong spam protection with CAPTCHA and IP blocking features to save your surveys from spam and bots
- Option to translate the surveys into multiple languages, allowing for a wider reach
- Survey themes and layouts lack advanced features
- The reporting feature is a bit complicated to use
Paid plans start at $7.23/month
4. SurveyKing – Best for creating customized, anonymous surveys
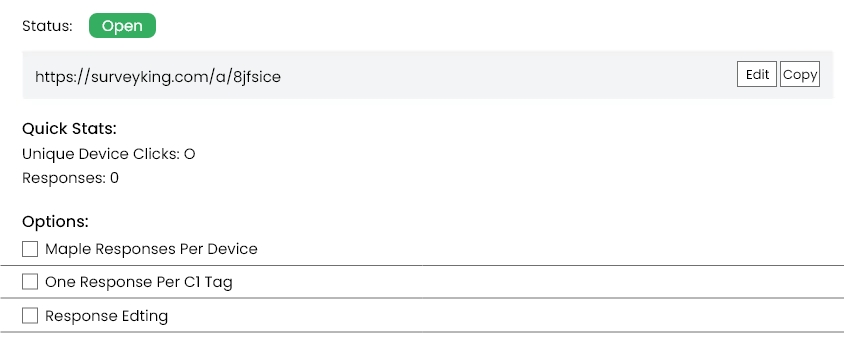
SurveyKing is a powerful survey tool that can be effectively utilized in an academic setting for gathering feedback and conducting research surveys.
With SurveyKing’s highly customizable survey features, you can effortlessly create surveys tailored to your specific needs, such as classroom feedback, student satisfaction surveys, and campus facilities feedback surveys, among others.
One notable feature of SurveyKing is its ability to provide truly anonymous surveys. Utilizing a seal with an info link, SurveyKing encourages respondents to provide honest feedback without fear of identification.
This is particularly valuable in educational scenarios where sensitive topics, like bullying, require a safe and confidential environment for students to share their experiences.
SurveyKing also offers transactional surveys that capture feedback from students after specific academic activities, such as exams or workshops, or after completing a course.
In addition to these functionalities, SurveyKing offers advanced question types like MaxDiff, which can be utilized in labor relation surveys, letting instituitions gather valuable insights for proper negotiations while maintaining complete anonymity.
Considering all these factors, I’d say it is an excellent choice if you wish to conduct in-depth surveys in this field with the accuracy and precision required.
- Highly customizable surveys with advanced question types for gathering specific feedback.
- Truly anonymous surveys with a seal and info link to encourage honest feedback.
- Transactional surveys to capture feedback after academic activities like exams or workshops.
- Advanced question types like MaxDiff (also known as best-worst scaling where the choice is between two extremes) for valuable insights in labor relation surveys.
- Easy capture of positive reviews and testimonials from students and alumni.
- User-friendly interface, customizable options, and robust reporting tools for enhancing the learning experience.
- While SurveyKing has advanced question types, some advanced features may not be available, like custom script questions or advanced skip logic.
- SurveyKing only offers basic integration features with other tools like Mailchimp or Google Analytics.
Paid plans start at $19/month.
5. SurveySparrow – Best for conversational surveys
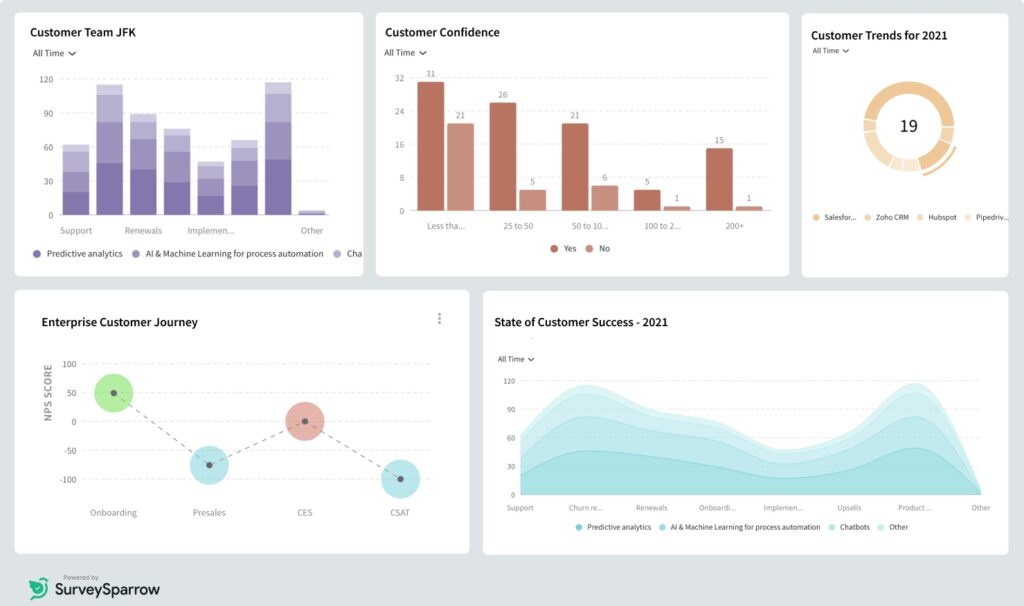
SurveySparrow is an omnichannel experience management platform that can also be used as an academic software in educational institutions.
With its ability to automate actions, track trends, and build visual dashboards, SurveySparrow is a powerful aid that you can utilize to gather valuable insights, enhance student engagement, and improve overall academic performance.
The tool has features like customizable surveys, ticket management, and business intelligence that are also employable in academics and make the same impact as they do in a business setting.
One perk of SurveySparrow is its ability to create conversational surveys for any purpose and in any language – a feature incredibly useful in bypassing survey fatigue or abandonment.
Topping it off, SurveySparrow also facilitates offline data collection, and offers advanced integrations to streamline workflows, making it a comprehensive solution that wants little else to serve its purpose.
- Conversational surveys that engage respondents naturally and minimize survey fatigue
- Advanced survey logic and branching to personalize surveys based on previous answers given
- Seamless Integrations with popular applications like Salesforce and HubSpot for streamlined workflows
- Access to valuable insights through intuitive dashboards and trend analysis through real-time reporting and analytics
- Offline survey capability that allows users to collect feedback anywhere, even without an internet connection
- The drag and drop question box functionality can be somewhat buggy and might not align correctly
- lacks advanced email marketing features, making it difficult to send reminders or segment audiences easily
Custom pricing available on request.
6. Qualtrics Survey – Best for in-depth data analysis
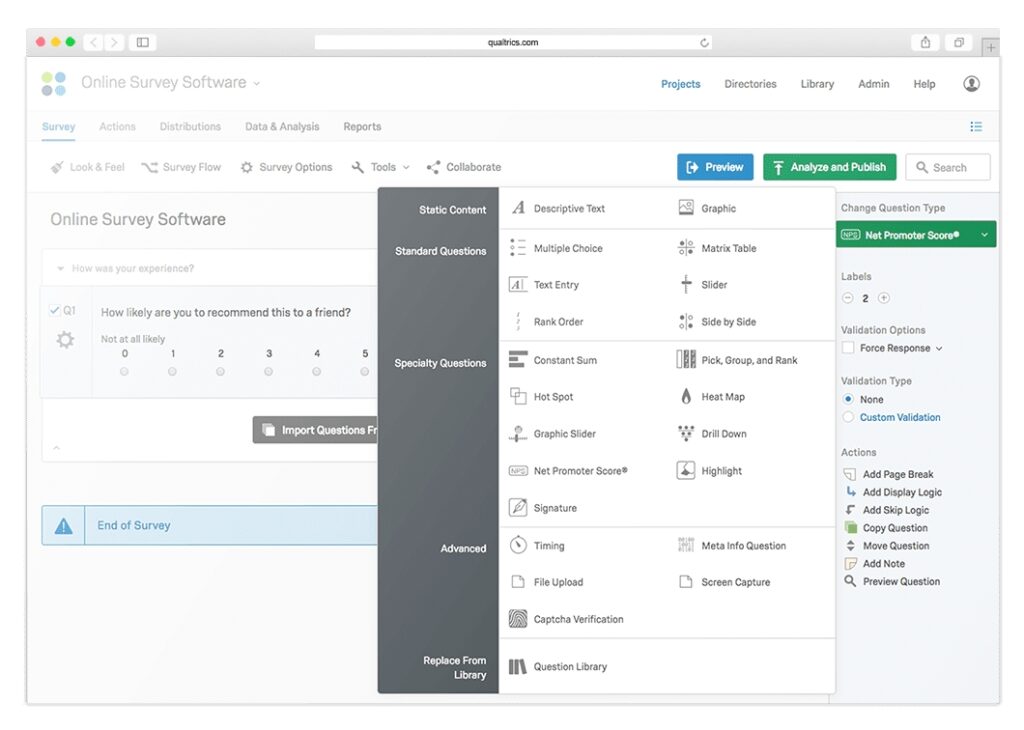
Qualtrics Survey is a widely-used software in the field of market surveys, but the tool has a range of features and capabilities that make it highly suitable for academic research and assessment purposes as well.
One key aspect of Qualtrics Survey is its flexibility in creating and customizing surveys to suit specific research needs. You can choose from a wide range of question types, interactive features, and media options to enhance response rates and gather the necessary data.
Additionally, Qualtrics Survey offers real-time data analysis and reporting capabilities, including graphs and charts to allow you to interpret and present your findings effectively.
Another notable feature of Qualtrics Survey is its usability and accessibility. Users can access pre-made surveys or create their own, and the platform supports multiple languages, making it accessible for researchers from diverse backgrounds. Moreover, Qualtrics Survey ensures data security and confidentiality, which are critical considerations in academic research.
In my opinion, Qualtrics Survey can serve as a valuable academic software that offers educational institutions all the necessary functionalities to design, distribute, and analyze surveys for research and assessment purposes.
- Easy-to-use interface with drag-and-drop functionality and pre-configured surveys
- 360-degree solution for customer professionals that covers feedback collection, analysis, action planning, and reporting
- Text analysis tools that use artificial intelligence and natural language processing to extract insights from open-ended responses
- Contact management system to automatically segment, target, and follow up with your respondents
- Seamless integrations with popular platforms such as Salesforce, Marketo, Slack, Tableau, and more
- The UI could be more simplified for a better user experience
- The software may be difficult to navigate if you are new to it
Starts from $1500/year
7. SurveyMonkey – Best for AI-powered academic surveys
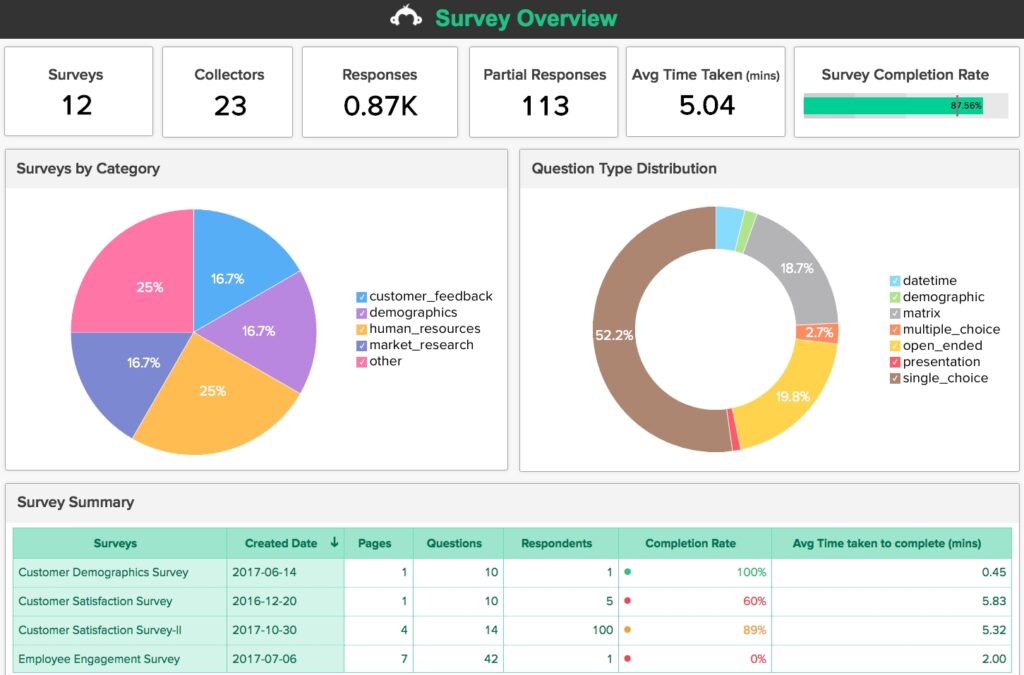
SurveyMonkey is a versatile academic software that allows researchers in academia to conduct surveys for various purposes, including testing hypotheses and gathering data on attitudes and behaviors in domains such as business, politics, and health.
The tool has a separate sub-section for academic surveys with both close-ended and open-ended questions to collect rich qualitative data and gain insights into various research topics as well as AI-friendly surveys that conveniently create questions in just minutes.
It also has a library of various question types like multiple choice, rating scale, matrix, and open-ended that you can effortlessly design surveys tailored to your needs. Not to mention, the tool offers a rich library of pre-made templates for diverse topics, making survey creation even more convenient.
SurveyMonkey features a robust analytics section, enabling you to access real-time results on the dashboard or export them as PDF, Excel, or CSV files.
This comprehensive suite of features empowers you to capture valuable insights from your target audience and propel your business forward.
- The ability to share surveys via custom links, QR code, email, social media, or website embedding
- You can include complex question branching logic in surveys
- Easily personalize surveys by adding your own logos and images
- Randomizing questions can help reduce the question order bias
- Users can get started quickly by using pre-built survey templates
- Some users have reported problems with the SurveyMonkey mobile app, such as crashes and difficulty logging in.
- Although SurveyMonkey offers a variety of question types, some advanced or specialized question formats may not be available.
Starts at $25/ user/month. 50,000 responses per year.
8. QuestionPro – Best for large-scale surveys
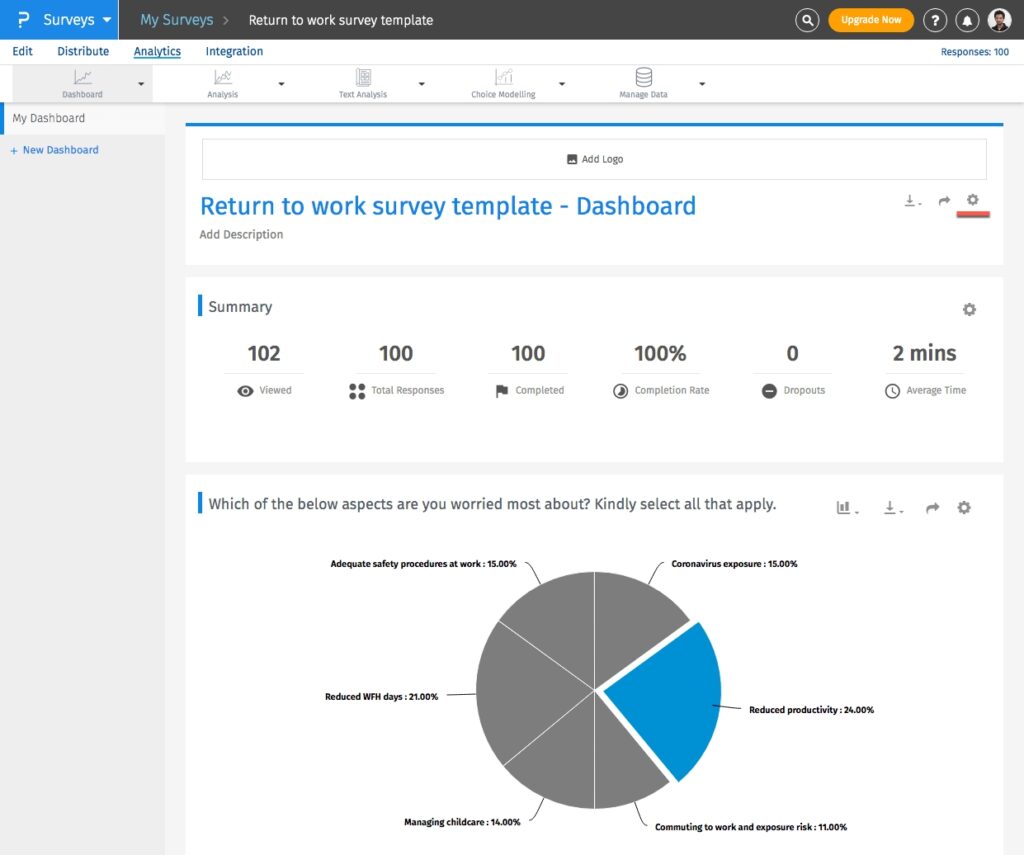
QuestionPro provides an easy-to-use survey software platform that allows you to design, send, and analyze online surveys quickly and efficiently.
The tool has a variety of professionally designed survey templates specifically tailored for academic research that I found to have increased the efficiency of my surveys by quite a lot.
It also includes advanced logic and workflow options, such as survey branching, skip logic, and randomization, and these enabled me to create surveys with complex question paths for gathering specific data and insights.
As a plus point, QuestionPro supports multilingual surveys, letting users conduct survey research in various languages to capture more diverse responses.
To ensure data security and compliance, QuestionPro is built with data privacy protection, anonymity, and compliance features, including certifications like GDPR, ISO 27001, CCPA, and PCI-DSS.
In the academic context, you can benefit the most from the Predictive Pricing feature, which would allow you to choose reliable and cost-effective plans for academic research.
- User-friendly interface and a large library of questions and templates to create surveys in minutes
- Customized URL, branding & themes to modify the look and feel of your surveys with your domain themes
- Option to collaborate with your team members and share surveys, reports, data, etc., and assign roles and permissions to your team members
- Real-time data analysis on a dashboard account as charts, graphs, summaries, cross-tabs, filters, and data trends
- Additional cost for advanced features even with a paid plan
- Limited customization and formatting options
Paid plans start at $99 per user per month
9. SurveyLegend – Best for mobile surveys
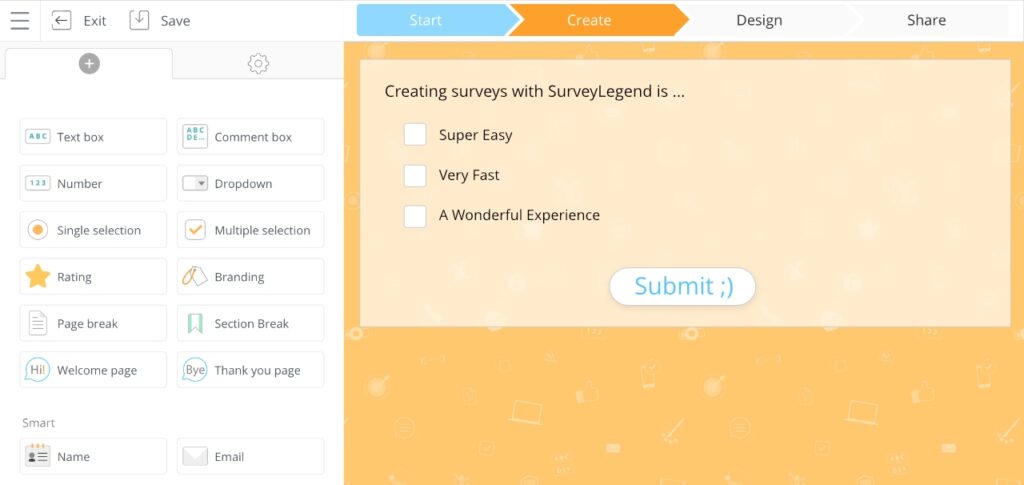
I have used SurveyLegend, and the tool definitely deserves a mention on this list.
Aside from being user-friendly and visually appealing, SurveyLegend’s appeal as an academic survey software mostly comes from how easy it is to access on mobile devices.
When dealing with an audience primarily dependent on phones, this mobile responsiveness allows you to reach a broader audience and ensures a much higher completion rate than its counterpart.
Speaking of features, SurveyLegend provides advanced question types, including Likert scales and multiple-choice grids, enabling researchers to gather in-depth feedback from survey participants.
SurveyLegend also offers collaboration and data-sharing capabilities, making it an effective tool for group research projects. Its data analytics and reporting features analyze survey responses effectively, generating visual reports and exporting data in various formats for further analysis or presentation purposes.
Data privacy and confidentiality are prioritized, as SurveyLegend provides SSL encryption and compliance with data protection regulations. The tool’s secure handling of survey responses and protection of participants’ privacy make it suitable for academic research that involves sensitive data.
- User-friendly interface with a drag-and-drop editor for easy survey creation
- Advanced analytics and reporting tools for real-time data analysis and insight generation
- Collaboration features allow teams to work together on survey creation and track changes
- Versatile distribution options via email, social media, embedded links, and offline data collection
- Data security and privacy measures, including SSL encryption and GDPR compliance, ensure data protection
- Limited options when it comes to customizing the design and branding of surveys
- Users may find the UI a bit cluttered
Paid plans start at $15/month.
10. Google Forms – Best for free surveys
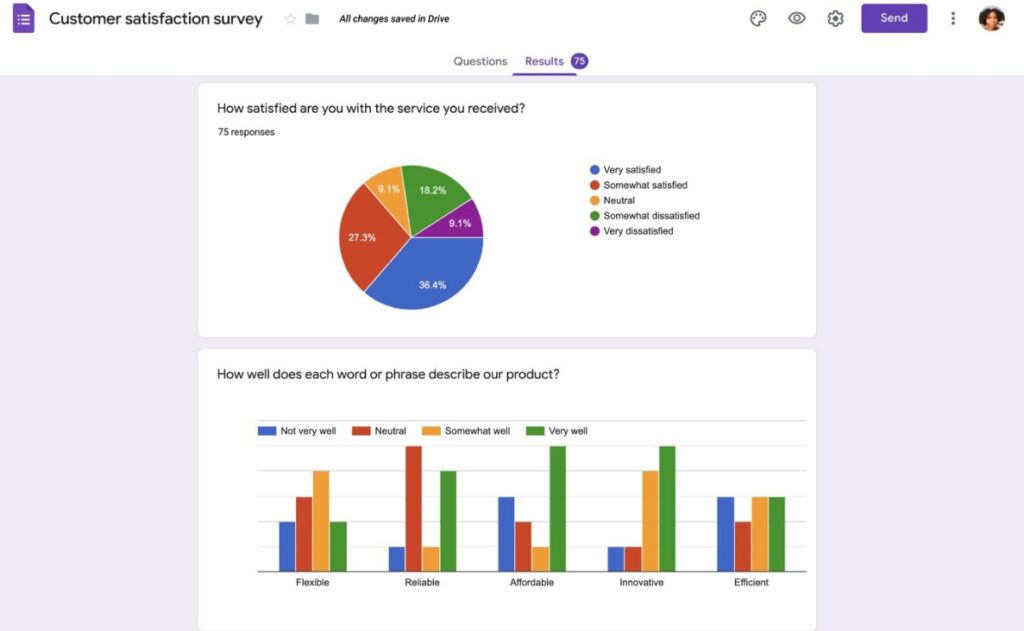
If you are familiar with Google, chances are, you have used or at least heard of Google Forms. It is offered as a part of the Google Suite whenever you set up a Google account.
The tool is simple, versatile, highly adaptive to multiple device types, and allows users to create surveys, quizzes, and forms for data collection purposes.
You can design custom surveys with different question types, including multiple-choice, short-answer, and Likert scale questions.
Secondly, Google Forms allows collaboration and sharing among users so that multiple members can collaborate on creating and editing forms, making it ideal for group projects or research studies involving teamwork.
Another advantage of using Google Forms is the real-time data analysis feature. As responses are collected, the tool automatically generates summary statistics and graphs to visualize the data. This can be especially helpful for quick data analysis or in-class discussions.
Furthermore, Google Forms is integrated with other Google Workspace tools, such as Google Sheets, allowing easy data export and analysis.
Lastly, Google Forms is a cost-effective solution for academic institutions as it is free to use!
- Templates that offer a variety of prebuilt form designs for different purposes, such as feedback, registration, quiz, order, and more
- Question formats that allow you to choose from different types of questions, such as multiple choice, short answer, checkboxes, linear scale, date, time, and more
- Conditional logic that enables you to show or hide questions based on the responses of the respondents
- Theme customizations that let you change the appearance of your forms by adding images, videos, logos, colors, and fonts
- Reporting and analytics that automatically save and display the responses in Google Sheets, where you can view charts, graphs, and summaries of the data
- You will not be able to use the forms offline
- Limited design options
Free for anyone with a Google account
Final Verdict: Which Is the Best Online Survey Tool for Academic Research?
I understand that selecting the right tool from this list can be a difficult decision as they all seem to offer unique advantages and features. However, it is important to consider your survey needs, the audience you are surveying, and other relevant factors before making a final choice.
Based on that, here are my top three recommendations from the list:
Choice 1 – ProProfs Survey Maker : This is an online survey tool that can be used for various audiences and goals. ProProfs Survey Maker is highly versatile, flexible, and reasonably priced, making it an ideal choice for academic surveys where you need a large amount of data collected and processed quickly. It permits you to personalize your surveys by selecting from multiple question types, themes, and templates. Additionally, you can tailor your surveys to match your brand, add branching logic to personalize them, and access real-time analytics.
Choice 2 – Qualaroo: This survey widget helps you gather feedback from your website visitors, measure your Net Promoter Score (NPS), understand user behavior, and enhance user experience. Qualaroo surveys are short and show up in context, which means you can get more responses and valuable insights without being intrusive. You can even target specific groups of users and trigger surveys based on their actions.
Choice 3 – Zoho Survey: You can use this tool to create conversational surveys using different questions and templates. The platform offers options to match the survey to your institution’s branding and personalize the survey experience. It is also affordable and can adapt to changing academic needs.
If you ask me, I’d recommend using ProProfs Survey Maker. It is a user-friendly tool with a wide range of features, including survey filtering, multimedia capabilities, polls & sidebars, and survey scheduling, and has consistently delivered excellent results for me, regardless of the purpose of the survey.
Frequently Asked Questions
What is the use of online surveys.
Online surveys have various uses and benefits. They allow researchers, businesses, and organizations to gather data and insights from a large and diverse group of respondents. These surveys can be used for market research, customer feedback, academic research, employee satisfaction surveys , event feedback, and much more, with multiple advantages, including faster data collection, real-time analytics, cost-effectiveness, and convenience for both respondents and survey creators.
How to select the best online survey creator?
When choosing an online survey creator, consider the following factors – ease of use, features such as question types, customizability, survey logic, and data analysis capabilities, templates and themes, integration options, and pricing.
Watch: How to Choose the Best Survey Software
How to choose a survey tool for academic projects?
When selecting a survey tool for academic projects, consider these key aspects:
- Research requirements : Determine the specific needs of your academic project, such as the nature of the research, target audience, and required survey features.
- Data privacy and security : Ensure the survey tool provides adequate data protection measures, especially when dealing with sensitive academic data.
- Collaboration features : If your academic project involves multiple researchers or survey creators, consider a tool that allows collaboration and sharing of survey designs and data.
- Academic-friendly features : Look for features that are particularly useful for academic research, such as randomization, skip logic, survey branching, and options for academic citation

About the author
Jared cornell.
Jared is a customer support expert. He has been published in CrazyEgg , Foundr , and CXL . As a customer support executive at ProProfs, he has been instrumental in developing a complete customer support system that more than doubled customer satisfaction. You can connect and engage with Jared on Twitter , Facebook , and LinkedIn .
Popular Posts in This Category

What is a Web Survey: Definition, Types & Characteristics

75+ Human Resources Survey Questions To Ask Your Employees

Top 10 Demographic Survey Questions & Examples

8 Best Guest Survey Software You Must Have in 2024

How to Ask Sensitive Questions in Surveys

How To Build A Customer Loyalty Program

- Market Research
- Participants
- Case Studies
- Academic Research

Academic Researchers
ThinkSurvey is the most trusted platform for online data collection on any of your questionnaire tools whenever you have a:
Thesis to submit
Research papers to publish, statistics reports to complete, seminar presentations to be done, why researchers trust our audience panel, data quality.
Every participant goes through eligibility checks and screening before attempting any study
Vast Demographics
Be it students, professionals, housewives, or businesses we have every participant
Timely Delivery
Get responses within the defined timeline to ensure there is no delay in the next steps
Be it 50 or 5000. Get as many responses as needed for your study
Happy Participants
Our ethical rewards policy means our participants stay honest while answering questions
Customer Support
We assign a dedicated person who would assist you in every step you take
Types Of Surveys You Can Do
Poll-based surveys.
Run short surveys and get responses instantly. Our fastest closing surveys.
Image-based Surveys
Pictures speak a thousand words. Our participants like them too.
Scenario-based Surveys
Present various scenarios to our participants and capture their responses.

Conditional Surveys
Have branching or if-else condition in your study? You are on the right platform.
Long Surveys
Be it a 30 min survey or a 30 days study. Our platform supports it all.
Supervisor-Subordinate Surveys
Looking to study the team environment? Reach out to managers & their teams.
What Researchers Say About Us

Swetarupa Chatterjee

Dr Naman Screen

Indranil Nandy

Meera Seshanna

Abhishek Deokule
Contact now to see us more directly and connect with you in real time..

- Start-up Research
- Vendor Login
- Vendor Sign-up
2023 © ThinkSurvey. All Rights Reserved.
- Terms and Conditions
- Privacy Policy
- Disclaimer Policy
- Skip to main content
- Skip to primary sidebar
- Skip to footer
- QuestionPro

- Solutions Industries Gaming Automotive Sports and events Education Government Travel & Hospitality Financial Services Healthcare Cannabis Technology Use Case NPS+ Communities Audience Contactless surveys Mobile LivePolls Member Experience GDPR Positive People Science 360 Feedback Surveys
- Resources Blog eBooks Survey Templates Case Studies Training Help center
Home Surveys
Resources for Academic Research: 12 Best Websites & Tools

It is best to use scholarly or professional resources that are reliable, accurate, and valid for academic coursework and resources for academic research project assignments.
These are typically books and articles that have been reviewed before publication, but they can also be media and websites from reputable organizations and institutions.
When you do a research project, write a paper, or start a blog, you would then read articles to see what other people have done and then build on their work.
What are Resources for Academic Research?
Resources for academic research are the tools, materials, and information sources that scholars, students, and researchers use to conduct thorough and accurate research on a given topic.
Academic journals, books, online databases, primary and secondary sources, and research tools such as citation generators, reference managers, and statistical analysis software are examples of these resources .
Access to reliable and diverse resources is essential for producing high-quality academic work that is credible, informative, and current.
12 Best Websites, Tools & Resources for Academic Research
What sources will lead you to trustworthy resources for academic research? When you need to find sources, use these academic resources instead of scrolling through pages of search results.
- Google Scholar
Google Scholar offers a wide range of scholarly literature, including articles, theses, books, and conference papers, making it a great resource for academic study.
Google Scholar allows researchers to search for information on a topic, find relevant material for their literature review, track citations of their work, remain up-to-date on new research in their field, and evaluate their work using metrics like the h-index and i10-index.
It’s a comprehensive, user-friendly academic research resource with powerful search capabilities, email alerts, and Google integration. This important website helps researchers find, access, and manage research data.
Features:
- Keyword, author, or title search box for scholarly literature.
- Tracking your work’s citations.
- Advanced search filters by publication date, author, or journal.
- Full-text articles and papers for convenient reference.
- Email alerts for keywords or topics to remain current on research in your profession.
- Work impact metrics like the h-index and i10-index.
- Google Books and Google Drive integration for saving and organizing research resources.
JSTOR is an online library with academic journals, books, and primary sources from many fields. It was started in 1995 as a non-profit organization by JSTOR Inc. and a number of academic institutions.
More than 12 million academic articles and books from more than 2,000 publishers are in JSTOR’s online library. Content on JSTOR comes from many different fields, such as the humanities, social sciences, and natural sciences.
Individuals and institutions can subscribe to JSTOR’s digital library, and researchers, students, and scholars worldwide use it as a reliable and complete resource for academic research.
- JSTOR offers scholarly journals, books, and primary materials.
- JSTOR material spans humanities, social sciences, and natural sciences.
- JSTOR’s stored content, including historical records, gives academics a broad perspective.
- Users can search the platform’s huge database for keywords, authors, titles, and more.
- PDFs of JSTOR articles can be downloaded.
- Sharing, citation, and exporting options help scholars collaborate on the platform.
- JSTOR’s pricing makes it’s content affordable for all sizes and budgets.
ProQuest is a global information content and technology company that gives access to research databases, electronic books, and digital archives. Eugene B. Power started it in 1938 as University Microfilms to store and distribute dissertations and theses on microfilm.
Today, ProQuest gives you access to a wide range of content, such as academic journals, newspapers, dissertations, and primary sources. The databases on ProQuest cover a wide range of subjects, including the social sciences, the humanities, and the natural sciences.
Researchers, students, and scholars worldwide use ProQuest because it is a reliable, all-inclusive resource for academic research.
Features :
- Offers access to research databases, e-books, and digital archives in a wide range of fields.
- There are a lot of academic journals, newspapers, dissertations, and primary sources in this collection.
- Included are the social sciences, the humanities, and the natural sciences.
- Users can search by author, title, keyword, subject, and other criteria.
- Many of its databases let you read articles and other materials in full text.
- Includes tools for saving research, organizing it, and sharing it with others.
- Offers different pricing options so that people and organizations of all sizes and budgets can use it.
- Offers easy access to ProQuest’s services through mobile apps and the web so that they can be used from anywhere.
- Users can get a lot of help with customer service and training.
- ResearchGate
ResearchGate is a social networking site for academics and researchers to cooperate. In 2008, a group of scientists founded it to allow researchers to share their work, communicate, and network.
One of the largest research communities online, ResearchGate has over 17 million users. The platform lets scholars create profiles, share publications, ask and answer questions, and network with like-minded researchers.
A citation tracker and reputation score help scholars manage their research activity on ResearchGate.
- A social network for scientists and researchers.
- Enables scholars to create profiles, share work, and network.
- Researcher cooperation and discussion platform.
- A citation tracker, online reputation score , and analytics assist scholars in managing their research.
- Job board and career resource for researchers.
- Allows field researchers to ask and answer questions.
- Offers a news feed on cutting-edge research.
- Provides scholars with peer assessment and feedback.
- Allows researchers to advertise their work and gain academic recognition.
- Provides free and premium memberships.
Zotero, a free, open-source reference manager, helps scholars organize and credit their sources. The George Mason University Roy Rosenzweig Center for History and New Media was founded in 2006.
Zotero lets users organize and search papers, books, web pages, and other study materials. It connects with various online browsers to gather and save research sources when surfing.
Researchers may easily format their citations and bibliographies in their discipline’s style with Zotero’s several citation formats. As a handy and effective tool for managing research resources, researchers, students, and scholars worldwide use it.
- A free, open-source reference manager.
- Organizes, stores, and cites research sources.
- Organizes and stores research items in a searchable database.
- It connects with various online browsers to gather and save research sources when surfing.
- Offers a variety of citation styles for producing citations and bibliographies.
- Enables people to share their research.
- Provides note-taking, labeling, and research source highlighting features.
- Automatically refreshes and syncs devices for easy research access.
- Provides many plugins and add-ons to increase functionality.
- Includes excellent documentation and a helpful user community.
Mendeley, a free reference management and academic, social network, lets researchers organize and share their articles and resources. It was started in 2008 by academicians and software developers and acquired by Elsevier in 2013.
Mendeley lets users create a searchable database of research papers, books, and other resources, including citation management, collaboration, and discovery capabilities. It offers groups, profiles, and suggestions to assist the researcher’s network.
Mendeley is a convenient and effective research management tool used by academics, students, and intellectuals worldwide.
- Free academic networking and reference management.
- Helps scholars organize and share papers and resources.
- Provides a searchable database of research papers, books, etc.
- Citation, collaboration, and discovery tools.
- Helps researchers network with groups, profiles, and recommendations.
- Annotates, highlights, and organizes research.
- Formats citations and bibliographies in several fields.
- Plugins and add-ons for major word processing and research applications.
- Automatic updates and device syncing make research materials accessible anywhere.
- Has a strong user community and substantial documentation.
Grammarly is a real-time writing tool that checks spelling, punctuation, and style. It was created in 2009 by linguists and software engineers and is now one of the most popular writing tools.
Grammarly is available as a browser extension, a desktop program for Windows and macOS, and a web app. It comes in free and premium versions, with the premium version adding genre-specific writing style advice, plagiarism detection, and readability scoring.
Grammarly improves writing for millions of writers, students, and professionals worldwide.
- Real-time grammar and spelling checker for writers.
- Helps writers improve style and tone.
- Software engineers and linguists created it.
- Use a web app, browser extension, or desktop software.
- Free and paid versions are available.
- The premium edition includes genre-specific writing style suggestions, plagiarism detection, and a readability score.
- Helps writers improve their writing quality and clarity.
- Available in English and others.
- Compatible with Google Documents, Microsoft Word, and others.
- Provides thorough grammar and writing instructions in an easy-to-use interface.
- Helps non-native English speakers improve their writing.
- Microsoft Academic
Microsoft Research created the free public search engine Microsoft Academic. It offers scientific, technological, engineering, mathematical, social science, and humanities research papers, journals, conference proceedings, and other scholarly publications.
Microsoft Academic leverages advanced natural language processing and machine learning to recognize author, publication, and research domain relationships, making it easier for scholars to find relevant material and track field changes. Citation analysis, research network visualization, and author profile management are also available.
- A free public search engine built by Microsoft Research.
- Accesses academic journals, conference proceedings, research papers, and other scholarly publications.
- Understands authors, publications, and research fields using advanced natural language processing and machine learning.
- Helps researchers find relevant literature and follow industry trends.
- Citation analysis, visualization of research networks, and author profile creation and management are available.
- Has powerful filters and semantic search in a user-friendly interface.
- Citation counts, trends, and co-authorship networks are provided.
- Enables users to set personalized research alerts.
- APIs enable developers to access data and functionality.
- Zotero and Mendeley integration supported.
Evernote lets users capture, organize, and share notes and information across devices. It helps users recall everything from personal notes and to-do lists to business documents and research notes.
Evernote lets users make and save notes in text, photos, audio, and site clippings. Tagging, search, and device synchronization make it easy for users to find and retrieve their notes anytime, anywhere.
The premium edition of Evernote includes PDF annotation, presentation mode, and team collaboration.
- Note-taking app for multiple platforms.
- Enables users to take, organize, and share notes across devices.
- Helps users recall anything from personal notes and to-do lists to research and business paperwork.
- Enables users to make and save notes in numerous formats, including text, photos, audio, and site clippings.
- Allows users to find and retrieve their notes anytime, anywhere, with labeling, search, and device syncing.
- Has configurable notebooks and notes and a simple interface.
- Offers note formatting, annotation, and editing features.
- Supports Google Drive, Slack, and other productivity apps.
- Provides a free version with limited functionality and a paid version with PDF annotation, presentation mode, and team collaboration.
- Search notes, journals, and tags with a sophisticated search function.
- To keep organized, lets users set reminders and make to-do lists.
The US National Library of Medicine (NLM) of the National Institutes of Health (NIH) maintains PubMed, a free biomedical literature and research article database (NIH). It comprises over 32 million citations and abstracts of papers from more than 8,000 biomedical journals and books, dissertations, and other health and medicine-related resources.
PubMed covers a wide range of medical issues, including clinical research, genetics, nursing, and pharmacology. Medical researchers, students, and professionals can use it to find the newest medical research.
- Free biomedical research article database.
- Managed by the US National Library of Medicine (NLM) at the NIH (NIH)
- 32 million citations and abstracts from over 8,000 biomedical journals.
- Clinical research, genetics, nursing, pharmacology, and more.
- Obtains full-text articles from PubMed Central (PMC)
- Includes Boolean operators, search fields, and filters.
- Accesses MeSH, a fully controlled vocabulary for indexing articles.
- Saves and exports search results and send email alerts for new publications matching search criteria.
- Has a simple interface and search tools.
- Links to important publications, citations, and other resources.
- PubMed has a smartphone app.
- QuestionPro Insight Hub
QuestionPro Insight Hub connects businesses and organizations to millions of consumers and expert panelists globally for market research. The platform allows users to build surveys, run polls, conduct focus groups, and collect data from social media, email, mobile devices, and websites. Advanced analytics and reporting options enable users to evaluate data and understand customer behavior, preferences, and opinions.
Businesses may use QuestionPro Insight Hub to acquire real-time feedback from their target audience, optimize their products and services, and make informed business decisions based on consumer insights. The platform is appropriate for startups to enterprise-level enterprises in fields including healthcare, education, finance, and more.
- Access to millions of professional and consumer panelists all over the world
- Customizable surveys with different types of questions, themes, and templates
- Advanced logic and branching options for surveys
- Integration with many data collection sources, like social media, email, mobile devices, and websites
- Text analytics and sentiment analysis are built in for free-form responses.
- Real-time reporting and analytics with dashboards and charts that the user can change
- Collaboration tools that let team members share surveys, results, and insights
- Survey participants can get invitations and reminders by email that they can customize.
- Tools for running moderated and unmoderated discussions in online focus groups
- Polling tools to get quick feedback from customers and stakeholders and to get them involved
- Targeting options that make it easier to reach specific groups and demographics
- Compliance with GDPR and CCPA for privacy and security of data
- API and the ability to connect to other business platforms and applications.
- QuestionPro Live polls
QuestionPro Live Polls lets presenters communicate with their audience by running live polls during presentations, meetings, webinars, and other events that require real-time input. Presenters can modify QuestionPro Live Polls and obtain rapid audience reactions.
QuestionPro Live Polls include:
- Different question kinds.
- Configurable designs.
- Real-time live polling results.
- Multiple distribution choices.
- Audience engagement tools.
- Analytics and reporting.
- Integration with other platforms.
The solution lets presenters generate multiple-choice, rating scales, and open-ended polls.
SMS, email, QR codes, and social media to distribute QuestionPro Live Polls. Presenters and guests can instantly see real-time polling results on the screen. Presenters can quickly poll their audience regardless of location or device.
QuestionPro Live Polls encourages audience participation with countdown timers, animations, and gamification. Presenters can learn about audience opinions, preferences, and habits using poll analytics and reporting.
QuestionPro Live Polls is great for audience engagement, real-time feedback, and interactive presentations and events.
Features:
- Multiple question types, including multiple-choice, rating scales, and open-ended questions
- Poll designs that can be changed to fit the theme of the presentation or event
- The results of the poll were shown on the screen right away.
- Several ways to spread the word, like SMS, email, QR codes, and social media
- Tools for getting people to pay attention, such as countdown timers, animations, and gamification elements
- Analytics and reporting tools can help you determine what your audience thinks, likes, and does.
- Integration with other platforms, like PowerPoint, Zoom, and other video conferencing tools
- You can target your audience based on different demographic and psychographic factors to get more accurate feedback and insights.
LEARN ABOUT: Speaker evaluation form
In conclusion, the 12 best websites, tools, and resources for academic research offer students, scholars, and researchers a wealth of information and tools to help them in their quest for knowledge. Databases, search engines, citation generators, and collaboration tools are just a few of the features these resources offer.
Using these resources, researchers can improve their research and produce high-quality academic work. Researchers should keep up with the latest tools and technologies, as these can greatly improve their research and help their field advance.
QuestionPro’s Insight Hub and Livepolls are powerful data collection tools. These tools have various features, such as doing surveys, visualizing data, and polling in real-time, which can greatly improve the research process.
With the ability to collect data from a wide range of sources, researchers can gain valuable insights and come to conclusions that are based on facts. Combining these two tools can help researchers do high-quality research and make important contributions to their field. So get more help for your academic research with the help of QuestionPro.
MORE LIKE THIS
8 leading brand health tracker to track your brand reputation.
Mar 26, 2024

Top 15 UX Research Tools in 2024: Complete Guide

10 Top Customer Loyalty Software to Boost Your Business
Mar 25, 2024

Top 13 Anonymous Employee Feedback Tools for 2024
Other categories.
- Academic Research
- Artificial Intelligence
- Assessments
- Brand Awareness
- Case Studies
- Communities
- Consumer Insights
- Customer effort score
- Customer Engagement
- Customer Experience
- Customer Loyalty
- Customer Research
- Customer Satisfaction
- Employee Benefits
- Employee Engagement
- Employee Retention
- Friday Five
- General Data Protection Regulation
- Insights Hub
- Life@QuestionPro
- Market Research
- Mobile diaries
- Mobile Surveys
- New Features
- Online Communities
- Question Types
- Questionnaire
- QuestionPro Products
- Release Notes
- Research Tools and Apps
- Revenue at Risk
- Survey Templates
- Training Tips
- Uncategorized
- Video Learning Series
- What’s Coming Up
- Workforce Intelligence
We use cookies on reading.ac.uk to improve your experience, monitor site performance and tailor content to you.
Read our cookie policy to find out how to manage your cookie settings.
This site may not work correctly on Internet Explorer. We recommend switching to a different browser for a better experience.
Online survey tools
Survey tools can be useful data collection instruments for a variety of research and research-related purposes, but should be used with care.
Considerations of information security and legal compliance apply if you are using online instruments to collect (and thus store) personal data. The third-party service provider collecting personal survey data on your behalf is acting in the capacity of a data processor as defined under data protection laws. Whenever a data controller uses a data processor, a written contract must be in place so that both parties understand their responsibilities and liabilities.
Basic web forms from commercial cloud services such as Google Forms are not suitable for collecting and storing personal data. You should use a service provider under agreed terms of service that provide specific guarantees about the processing of personal data in accordance with UK data protection laws.
The University provides access under institutional agreements to a number of tools with survey capabilities.
Online Surveys
Online Surveys is a tool provide by Jisc and designed for use in academic research. Available to University staff and students. To obtain an account contact the Planning and Strategy Office .
Qualtrics is an online survey tool widely used in academic research. Available to Henley Business School and Agriculture, Policy and Development staff and students. HBS: To log in visit the Qualtrics HBS login page . If you require assistance, contact Henley Information and Learning Systems . APD: To obtain access, contact Giuseppe Nocella .
REDcap is secure web-based application for building and managing online databases and surveys. It can be used to collect data through both surveys and direct entry by members of a project team. Multiple instruments can be created in a single project, and longitudinal data collection is supported. Available to University staff and students. Visit the UoR REDCap web page for more information.
Microsoft Forms
Microsoft Forms is a basic web form application, useful for simple surveys and registration forms. Available to all University members through University Office 365.
If you wish to use other online services for collecting and processing personal data, but are unsure if they meet information security and data protection requirements, contact your DTS Business Partner (login required) for advice.
Robert Darby , Research Data Manager
Tel. 0118 378 6161
The online survey tool designed for Academic Research, Education and Public Sector organisations.

Surveys are an everyday part of education and research; from gathering organisational data or capturing research evidence, right through to analysing results and creating impact in presenting your findings.
They provide you with the information and answers you need to help you and your organisation make decisions, prove or disprove a theory, instruct and inform future strategy.
- Easy to use, no set-up required.
- GDPR compliant.
- Certified to ISO 27001 standard.
- Enables benchmarking across multiple organisations.
Easily find vetted research participants and AI taskers at scale

An unrivalled participant pool.
Your data is only as good as the people behind it. Our pool has 120,000+ active participants who are fully vetted and verified, so you know they’re real, unique, and AI-free.

Data quality you can depend on.
Our algorithms continuously monitor and manage the pool with 25 different checks so the quality of responses stays high. Participants are properly rewarded and highly engaged so you get rich, accurate, and comprehensive responses.
Regular manual and algorithmic quality checks.
120k active, reliable, and engaged participants., rich, reliable, and comprehensive responses..

Start quickly – and scale fast.
Our platform is self-serve and designed for ease of use. Move effortlessly from one-off or niche panels, to fully-automated AI training at scale – powered by our API.

Start now and see results in minutes
Run academic research with confidence, get high-quality human-powered data for ai.

Develop products based on the best possible data
Quickly scale market research with our easy-to-learn platform, contribute to world‑changing research..

Take control with your favourite tools
Find, filter, and re-use the right participants.
Find the right participants from the start. Use our 300+ filters to create custom, diverse or representative groups from our large, diverse pool. Once they’ve responded, you can message, group, and re-target them again.
Create rich, balanced, and bias-free datasets.
Select representative samples in the us and uk..

Flexible study design – with advanced support
Prolific allows for highly flexible project design, with support for text, imagery, voice, or interaction. This support projects ranging from A/B tests to recurring, time-sensitive, and multi-part projects; or multi-modal AI learning.

We’re making diverse, high-quality data available to anyone, anywhere.
Prolific was created by researchers, for researchers. Our rigorous and ethical approach means we deliver higher data quality for online behavioural research than all our competitors.
Trusted for 9 years by leading academics, researchers, and organisations
I'd recommend Prolific to anyone looking to quickly gather high-quality data, especially if they need to recruit specific kinds of participant. I honestly don't think my research would have been possible without Prolific.
Most amazon mechanical turk workers might respond with a comma-delaminated list of like four words. prolific participants were writing in full sentences and fully describing things. it just makes for much more impactful work., prolific has helped us obtain high-quality feedback from native speakers in a targeted, efficient and ethical manner. prolific has formed the backbone of our research evaluation framework, helping us provide metrics to demonstrate the success of our research both in international conference publications as well as for internal reporting., put prolific to the test. today..
Getting started is simple. With no contract or subscription – just a transparent service fee for each completed response.
Get started in 15 minutes
Want to know more.

If you are a research participant or have questions about becoming one, please visit our participants page.
High-quality human data to deliver world-leading research and AIs.
Follow us on
All Rights Reserved Prolific 2024
Just one more step to your free trial.
.surveysparrow.com
Already using SurveySparrow? Login
By clicking on "Get Started", I agree to the Privacy Policy and Terms of Service .
This site is protected by reCAPTCHA and the Google Privacy Policy and Terms of Service apply.
Enterprise Survey Software
Enterprise Survey Software to thrive in your business ecosystem
NPS Software
Turn customers into promoters
Offline Survey
Real-time data collection, on the move. Go internet-independent.
360 Assessment
Conduct omnidirectional employee assessments. Increase productivity, grow together.
Reputation Management
Turn your existing customers into raving promoters by monitoring online reviews.
Ticket Management
Build loyalty and advocacy by delivering personalized support experiences that matter.
Chatbot for Website
Collect feedback smartly from your website visitors with the engaging Chatbot for website.
Swift, easy, secure. Scalable for your organization.
Executive Dashboard
Customer journey map, craft beautiful surveys, share surveys, gain rich insights, recurring surveys, white label surveys, embedded surveys, conversational forms, mobile-first surveys, audience management, smart surveys, video surveys, secure surveys, api, webhooks, integrations, survey themes, accept payments, custom workflows, all features, customer experience, employee experience, product experience, marketing experience, sales experience, hospitality & travel, market research, saas startup programs, wall of love, success stories, sparrowcast, nps benchmarks, learning centre, apps & integrations, academic research software.
Gather data easily using the best Academic Research Software & make your research work credible!
Please enter a valid Email ID.
14-Day Free Trial • Cancel Anytime • No Credit Card Required • Need a Demo?
Craft academic research surveys to collect research data
Utilize multiple platforms to share surveys and gather data
Gain inestimable insights from academic research survey data
Present your academic research findings with detailed reports
- Academic Research Software: Overview
Our event registration form templates are not just fancy- looking forms to add sparkles to your events. They also manage the entire workflow for you. Once you build your customized, interactive event registration form using one of our templates, you can either embed it on a webpage or share it via email, or SMS.
Event registration is the first touchpoint between you and your audience. A single entry through the from kicks an entire workflow that is managed automatically.
Do You Need An Academic Research Software
- Must-have features of Academic Research Software
- SurveySparrow As Your Academic Research Software
Academic research is a great source to get profound knowledge about a specific topic(s). An academic research software can tremendously help in your research work. Here’s how!
Validate Research Using Solid Data
Go Beyond Textbook
Get Profiled Audience
Acquaint With Current Softwares & Technology
An academic research software helps you to gather data from target audience which enables you to substantiate your thesis with real-world, primary data.
Academic research allows you to gain new knowledge about a specific topic and explore territories beyond the textbooks and reference materials. This exposes the researcher to current trends, developments in existing theories, or formulation of entirely new ones, to name a few. Academic research software is adept in ensuring your research work taste immense success.
The research questionnaires you make requires to be sent to the right audience if you want to get accurate data. However, this is no simple task; when you opt for an academic research software that offers an online audience panel, it is simple to get an audience, belonging to various demographics. Ask the right people, the right questions, to get the correct answers.
As a research work is in progress, the individual comes upon the latest trends and technologies. Employing such research tools helps to develop the skill set and optimize the research efforts with ease.
Get me Started with the Best Academic Research Software
Must-have features of academic research software.
Are you looking for academic research software to spearhead your research purpose? We give you the following must-have features which any academic research software must provide!
Build Stunning, Smart & Personalized Surveys
The academic research software you opt for must enable to draft surveys that are visually-appealing, relevant, and offers a personalized experience to respondents. Don’t bore your audience with a dull survey that’s packed with numerous questions. Instead, keep it short and crisp. Ask what’s relevant using smart logic branching feature. Make surveys personalized to engage with your audience better. This will reflect in the completion rates.
Profiled Online Panel Audience
To get the answers you were looking for, you must ensure that it is asked to the right people. Thus, identifying the audience is very important. An academic research software that offers a panel audience is the best bet to get the correct respondents for your research work. The research software provides you with a panel of audience who are pre-screened and qualified and who belongs to diverse demographics.
If you wish to get high-quality data and impressive completion rates, drafting the perfect survey wouldn’t suffice. One must ensure that these surveys reach the target audience via diverse sharing platforms; be it email surveys, social media, web links, SMS surveys, embedded surveys, to name a few. More the channels the academic research software offers, the better it is. Make sure that the surveys receive extensive reach and visibility.
Obtain Rich Insights
A great academic research software not only helps to create & design surveys, send it to respondents, collect the data but also to analyze it to gather rich conclusions and profound insights. Slice and dice the data using the help of the platform to gain new perspectives and identify blind spots that were missed before. The software helps you refine the raw research data into polished information so that your research works becomes credible.
SurveySparrow As your Academic Research Software
Wish to find out how SurveySparrow is the finest academic research software that can fuel your research works till the finish line? Find out how!
Elegant Multi-UI Platform
SurveySparrow’s academic research software has not dual interfaces for the users to choose from. Start conversing with your respondents using chat-like surveys or conversational forms and get staggering survey completion rates. With survey themes, you can design and create stunning surveys- the reins are entirely in your hands!
Conditional Logic Branching
With skip logic and display logic, you can pose only what’s relevant to your audience and skip the rest. In this manner, you can avoid bombarding respondents with irrelevant questions and survey abandonment. Employ features like question piping to ensure a high degree of personalization for surveys.
Share Options
SurveySparrow’s academic research software is keen to assure that the surveys you make get the best visibility and reach your target audience efficiently. SurveySparrow holds many sharing channels such as,
Email surveys
Embed option, social media, strong reporting system.
SurveySparrow’s academic research software comes with a robust reporting module that turns the raw data into refined information. The software is equipped with a dashboard that renders detailed reports, and the advanced filters present breaks down the data into an easily readable format. Gather rich conclusions and gain profound insights thus. Research works such as market research and academic research surely finds a strong analysis module useful!
Online Audience Panel
SurveySparrow’s academic research software provides an online panel of audience, belonging to diverse demographics and backgrounds. Find the right audience for your research work and get the correct answers using SurveySparrow.
Kick-start your academic research work with SurveySparrow’s academic research software. Collect reliable, primary data directly from your respondents and gain rich insights to validate your research. Make your thesis work credible!
Happy Researching!
I want the Best Academic Research Software
A quick peek at the reviews.
Head over and read through what users say about us!
See how well we fare over our competitors
Our customers love us . want to know why.
"Smart, varied and loaded with opportunity for users to share insights they might not otherwise feel comfortable sharing..."
Digital Producer at Heat + Deloitte Digital
Katherine Stevens
Market Intelligence & Strategy Manager at Paysafe
Jaakko Jalkanen
Business Manager at Brella
Parisa Vassei
Founder at Parisa Consulting
Peter Vogopoulos
Business Advisor at Exceeding Limits
SurveySparrow powers your Surveys
Hi there, we use cookies to offer you a better browsing experience and to analyze site traffic. By continuing to use our website, you consent to the use of these cookies. Learn More
Try SurveySparrow for FREE
Claim a 14-day free trial to get a sneak-peek into all the finest features.
Root out friction in every digital experience, super-charge conversion rates, and optimise digital self-service
Uncover insights from any interaction, deliver AI-powered agent coaching, and reduce cost to serve
Increase revenue and loyalty with real-time insights and recommendations delivered straight to teams on the ground
Know exactly how your people feel and empower managers to improve employee engagement, productivity, and retention
Take action in the moments that matter most along the employee journey and drive bottom line growth
Whatever they’re are saying, wherever they’re saying it, know exactly what’s going on with your people
Get faster, richer insights with qual and quant tools that make powerful market research available to everyone
Run concept tests, pricing studies, prototyping + more with fast, powerful studies designed by UX research experts
Track your brand performance 24/7 and act quickly to respond to opportunities and challenges in your market
Meet the operating system for experience management
- Free Account
- For Digital
- For Customer Care
- For Human Resources
- For Researchers
- Financial Services
- All Industries
Popular Use Cases
- Customer Experience
- Employee Experience
- Employee Exit Interviews
- Net Promoter Score
- Voice of Customer
- Customer Success Hub
- Product Documentation
- Training & Certification
- XM Institute
- Popular Resources
- Customer Stories
- Market Research
- Artificial Intelligence
- Partnerships
- Marketplace
The annual gathering of the experience leaders at the world’s iconic brands building breakthrough business results.
- English/AU & NZ
- Español/Europa
- Español/América Latina
- Português Brasileiro
- REQUEST DEMO
Online Survey Software
Our software powers +1b surveys every year.
Request a Demo free account

Over 16K brands and 99 of the top 100 business schools use Qualtrics

Get answers to your most important market, brand, customer, and product questions with survey software that can handle everything from simple questionnaires to detailed research projects for the world’s biggest brands. Design your survey with our intuitive drag-and-drop survey tool, powerful logic, 100 plus question types, and pre-built survey templates
- Reach respondents wherever they are with surveys on mobile devices, apps, websites, chatbots and many more
- Create and test surveys in real time and collaborate effortlessly
- Uncover new insights with predictive intelligence and powerful statistical analysis built-in
- Launch your survey with confidence and improve survey quality with ExpertReview -Powered by iQ
- Integrate your surveys into your existing systems like Zendesk , Marketo , Adobe and many more
The most sophisticated survey software tool is also the easiest to use
Drag-and-drop simplicity for even the most advanced surveys.
Choose from 100+ question types and use advanced logic, branching, quotas, API integrations into Zendesk and email triggers to build and launch your project. It’s all done in an intuitive drag-and-drop software interface that makes even the most sophisticated surveys easy to create, launch and analyse.
Complete confidence in every decision
Make better decisions with real-time insights and reports you can share in seconds. Choose from over 30 different graph types, share reports online or export survey data popular programs formats and programs like Word, Powerpoint, PDF, CSV and SPSS.
Built-in intelligence with every type of survey
ExpertReview analyses every question in real-time and offers personalised survey design recommendations to boost response rates and get better quality data. It’s powered by iQ and applies artificial intelligence and PhD-designed best practices to give you complete confidence before you launch. And when your results come in, iQ applies detailed statistical and text analysis to get straight to the insights you need – all at the click of a button.
Start creating surveys today for free
Free account
Answers & insights from your audience, wherever they are
Wherever you need to gather data, our survey software solution can help. From a simple survey link you can paste anywhere, to advanced integrations with your CRM, to text message (SMS) and offline surveys, we’ll help you reach your target respondents no matter where they are.

Target the right customers with the right message
Customise your website surveys and intercepts with 20+ different targeting variables from geolocation to customer segments and site behaviour. It means you can offer customised promotions to drive conversion and gather the right feedback from the right audiences at every stage in the online journey. There’s no coding or IT support required – just set your variables, upload your creative and start personalising your digital experience .
Learn more about website feedback surveys
The only survey platform you’ll ever need
From simple one-off surveys to sophisticated global experience management solutions – Qualtrics scales with your ambitions. Our survey platform powers everything from market research projects to customer experience, product testing, employee experience and brand tracking projects. Trusted by 16,000+ businesses and institutions worldwide, including over 80% of the Fortune 100, our survey software helps them optimise the four core experiences of business: customers , employees , products , and brands.
See who we work with
Enterprise level survey data security
All your data is secure with enterprise-grade security features including data encryption, redundancy, continuous network monitoring, Single Sign On (SSO) and plenty more. With US, Canada, APAC and EU data sovereignty, it’s trusted by everyone from multinational banks to Government departments.
We’re ISO 27001 certified and we are FedRAMP authorized – that’s the “gold standard” of security certification used by the U.S. Government for SaaS providers. So you can rest assured your data is in good hands.
Learn more about security

Take control of your surveys with custom programming
Using Qualtrics’ API calls, you can apply your own custom code to automate survey creation and launch without ever touching the survey editor. Quatrics’ custom programming gives advanced researchers total flexibility at the code level for maximum speed. When you create surveys with code, you have absolute control of the logic, the question types, the embedded data, multimedia and all the other elements of your research. You don’t need to learn a new language to program in Qualtrics. Our APIs let you code in dozens of mainstream programming languages, including Python, Java, Node JS and more.
Learn about our API capabilities
Top rated survey software
The crowd has spoken. Qualtrics is proud to be the XM pioneer and a survey software category leader in the top right quadrant on the #1 independent software review site.
Read unbiased reviews from real customers and compare for yourself.
Benefits of online surveys
One of the best reasons to use a survey software program is that it can dramatically cut the costs of conducting one. You eliminate seemingly small expenses like printing and designing that quickly add up. But labor cost is where you’ll see the most dramatic effects. An online survey program doesn’t require hiring people to distribute and collect data, unlike a manual questionnaire. This helps you cut payroll dramatically, enabling you to conduct professional surveys with a much smaller team.
Data collection is the most tedious part of any manual survey program because of the time-consuming process. Plus, there’s the risk of recording the wrong data or losing it due to human error, which can invalidate your results. Questionnaire software eliminates these problems by transmitting responses directly from the user without anyone touching it in between. This “pure” data is then stored in a centralized server, so there’s also close to zero chance of losing it.
The faster collection also means that data is transmitted to you as soon as someone fills out the form. Hence, you can already get started extracting insights without having to wait for all your respondents to finish. What’s more, most online survey platforms have built-in analytics tools that allow you to transform and display data visually using charts and graphs. And remember, because data comes in real-time, you’ll see these analytics update in real-time as well. Scaling up your survey is also easy. Feel like you don’t have enough data? Simply send more surveys, and the new responses will automatically aggregate to the old data.
Using a survey application makes it infinitely easier to find and reach your intended respondents. You can provide multiple channels, from email to social media, so that people can answer your questionnaires more conveniently. You’re also not bound by geo
Ideally, your respondents should feel as relaxed as possible to get honest feedback. Because people can answer online surveys at their convenience, there’s a higher chance that they’ll be in the right state of mind when doing it. In addition, if your survey is anonymous, then that knowledge can also encourage the respondent to respond more openly without fear of judgment.
Creating surveys used to take lots of experience and a team of researchers and designers to pull off. With survey tools online, even small business owners with no experience can design and send professional surveys in minutes. Platforms like Qualtrics provide intuitive tools to help create questionnaires using simple drag-and-drop elements. They also offer templates and pre-programmed questions to make the process even easier. Finally, many platforms can analyze a survey to help improve response rates and data quality. Qualtrics, for example, uses the AI-powered ExpertReview feature to suggest changes on questions to increase chances of success.
What is survey software?
Learn about surveys
- Experience Research
- Survey Software
- Conjoint Analysis
- Reporting & Dashboards
- Regression Analysis
- Survey Distribution
- Panel Management
- Research Design
- Research Services
- Conjoint / MaxDiff
- Segmentation Analysis
- TURF Analysis
- Pricing Analysis
- Feature Prioritisation
- Concept Testing
- UX Research
- Key Driver Analysis
- Enterprise Survey Software
- Cross Tabulation
- Perceptual Mapping
Request Demo
Ready to learn more about Qualtrics?
- Harvard Library
- Research Guides
- Faculty of Arts & Sciences Libraries
GSAS Writing Toolkit
- Finding a Researchable Question
- Consult Your Library Experts
- Research Handbooks & Guides
Survey What is Already Known or Theorized
Track current trends, questions, and debates, prioritize your reading.
- Cross-Disciplinary Databases
- Data: Finding, Interpreting, and Visualizing It
- Tracking Stuff Down: Essential Services
- Methodology Sources
- Writing and Revision
- Style and Citation
- Presenting & Publishing Your Work
Handbooks and companions are typically edited volumes, with chapters written by authorities — or recognized experts. They synthesize current "consensus" thinking around a particular topic or present the most widely accepted perspectives and theories. They usually contain an extensive bibliography which you can mine as well.
Some major collections:
- Cambridge Companions
- Cambridge Handbooks Online: Psychology and Linguistics
- Cambridge Histories Online
- The John Hopkins Guide to Literary Theory and Criticism
- Oxford Handbooks Online
- Very Short Introductions
HOLLIS is also a good place to search for these tools. Try combining a broad keyword search with this format type (e.g., genocide AND handbook | historiography AND companion ). Other terms to try (for rough equivalents of the handbook) are "guide" and "reader."
JOURNAL TABLES OF CONTENTS AND LATEST ISSUES
Monitoring the latest issues of key journals in your field can help you catch wind of new ideas, schools of thought, and trending debates that may connect to your academic curiosity. The following tools aid your efforts to keep up to date:
- Browzine This app organizes scholarly journals by topic area and allows you to read them for free in a format optimized for your device.
- Current Contents Connect A current awareness database that helps busy researchers keep up to date by providing easy online access to complete tables of contents, abstracts, and bibliographic information from the most recently published issues of leading scholarly journals. To connect, select Current Contents Connect from the "Search in" drop-down options in the Web of Science database, linked here. PRO TIP: Use Table of Contents alerting to be notified when new issues of relevant journals are available. To do so, check out these instructions .
LITERATURE REVIEWS
Literature reviews are essays that help you understand and contextualize the principal contributions that have been made in your field. They track trends over time in the scholarly discussions of a topic and synthesize and connect related work. They cite the trailblazers and sometimes the outliers, and they even root out errors of fact or concept. Typically, they include a final section that identifies remaining questions or future directions. The following are recommended as starting points among the databases for finding literature reviews:
- Annual Reviews offers authoritative syntheses of the primary research literature in 46 academic fields, including anthropology, economics, law, political science, and sociology
- Find literature reviews in various databases by using the filters — before or after your keyword search — to limit to literature reviews. You can do this in some of the standard social science research databases you'll be using: APA PsycInfo , Social Science Premium Collection , and Web of Science , among others.
- While faculty may have different opinions on whether dissertations should be cited in your research, they'll often agree that Dissertations can be gold mines for their bibliographies. Moreover, by convention, dissertations always have a literature review section (normally an entire chapter) in which writers lay the groundwork for their studies by identifying and synthesizing what's come before them. They're often worth a look as you gather a list authorities to track down and read. And sometimes, they're great places to find primary sources, survey instruments, case studies, and more.
- This slideshow is a quick primer on conducting research for and writing a literature review .
Often the issue in information-seeking isn't scarcity of material, but is overabundance. Annotated bibliographies that are created and curated by scholars aim to address the common problem of knowing what to read, whom to read, or which voices in the conversation to attend to more fully.
- Oxford Bibliographies Online Combines the best features of the annotated bibliography with an authoritative subject encyclopedia. Entries identify key contributions to a topic, idea, person, or event and indicate the value of the work.
- << Previous: Research Handbooks & Guides
- Next: Cross-Disciplinary Databases >>
Except where otherwise noted, this work is subject to a Creative Commons Attribution 4.0 International License , which allows anyone to share and adapt our material as long as proper attribution is given. For details and exceptions, see the Harvard Library Copyright Policy ©2021 Presidents and Fellows of Harvard College.
National Center for Science and Engineering Statistics
- All previous cycle years
The GSS is an annual census of all academic institutions in the United States and its territories granting research-based master’s degrees or doctorates in science, engineering, and selected health fields as of the fall of the survey year.
Survey Info
- tag for use when URL is provided --> Methodology
- tag for use when URL is provided --> Data
- tag for use when URL is provided --> Analysis
The Survey of Graduate Students and Postdoctorates in Science and Engineering (GSS) is an annual census of all U.S. academic institutions granting research-based master's degrees or doctorates in science, engineering, and selected health fields as of the fall of the survey year. The survey, sponsored by the National Center for Science and Engineering Statistics within the National Science Foundation and by the National Institutes of Health, collects the total number of master's and doctoral students, postdoctoral appointees, and doctorate-level nonfaculty researchers by field of study or research, demographic characteristics, and other characteristics, such as source of financial support.
Areas of Interest
- STEM Education
- Science and Engineering Workforce
Survey Administration
RTI International is the data collection contractor. The survey data are collected through coordinators at eligible institutions.
Survey Details
- Survey Description (PDF 129 KB)
- Data Tables (PDF 5.8 MB)
Featured Survey Analysis
Graduate Enrollment in Science, Engineering, and Health Continues to Increase among Foreign Nationals, while Postdoctoral Appointment Trends Vary across Fields

GSS Overview
Data highlights, graduate student enrollment in science, engineering, and health fields increased by 5% from 2021 to 2022.
Methodology
Survey description, survey overview (2022 survey cycle).
The Survey of Graduate Students and Postdoctorates in Science and Engineering (GSS) is an annual census of all academic institutions in the United States and its territories (Guam and Puerto Rico) granting research-based master’s degrees or doctorates in science, engineering, and selected health (SEH) fields as of the fall of the survey year. Sponsored by the National Center for Science and Engineering Statistics (NCSES) within the National Science Foundation and by the National Institutes of Health, the GSS collects counts of enrolled graduate students, postdoctoral researchers (postdocs), and doctorate-holding nonfaculty researchers (NFRs) at these institutions by field of study, demographic characteristics, and other characteristics, such as source and mechanism of financial support. Results are used to assess shifts in graduate enrollment, shifts in postdoc and NFR appointments, and trends in financial support.
Data collection authority
The information collected by the GSS is solicited under the authority of the National Science Foundation Act of 1950, as amended, and the America COMPETES Reauthorization Act of 2010. The Office of Management and Budget control number is 3145-0062 and expires on 31 August 2023.
Major changes to recent survey cycle
Key survey information, initial survey year, reference period, response unit.
Organizational units (e.g., academic departments, degree-granting programs, university-affiliated research centers, and health care facilities) in academic institutions.
Sample or census
Population size.
A total of 22,519 organizational units at 690 academic institutions.
Sample size
Not applicable.
Key variables
Key variables of interest are listed below.
- Full-time master’s and doctoral graduate students by demographic and financial support characteristics
- Part-time master’s and doctoral graduate students by demographic characteristics
- Postdocs by demographic and financial support characteristics and by type and origin of doctoral degree
- Doctorate-holding NFRs by sex and type of doctoral degree
- Institutions by name, location, highest degree granted, and other institutional characteristics (e.g., historically Black college or university, Carnegie Classification, and public or private control)
- Schools by name, Integrated Postsecondary Education Data System (IPEDS) unique identifier, type (e.g., graduate school and medical school), and other characteristics (e.g., Carnegie Classification)
- Organizational units by name, field of study, and highest degree granted
Survey Design
Target population.
The survey target population is all academic institutions in the United States and its territories (Guam and Puerto Rico) that grant research-based master’s or doctoral degrees in SEH fields. A research-based graduate degree program requires the training in, and conducting of, independent research as part of the curriculum. SEH fields are defined using IPEDS Classification of Instructional Programs (CIP) codes. This population includes branch campuses, affiliated research centers and health facilities, and separately organized components, such as medical or dental schools, schools of nursing, and schools of public health.
Sampling frame
The total universe in 2022 included 22,519 units at 690 academic institutions in the United States that granted research-based master’s degrees or doctorates in SEH fields. Eligible academic institutions are identified primarily through IPEDS.
Sample design
The GSS is a census.
Data Collection and Processing
Data collection.
The survey data are collected through coordinators at eligible institutions. Coordinators are assigned by their institution and are responsible for identifying all GSS-eligible units, collecting the requested data, and submitting the data to the survey contractor.
Coordinators are provided access to the GSS Web survey to report aggregate counts on enrolled master’s and doctoral students, postdocs, and NFRs in each eligible unit, as of the fall term of academic year 2022. Reporting is done by the coordinator uploading a file with requested data to the GSS website, which automatically aggregates the data and populates the cells of the Web survey instrument for each eligible unit. Alternatively, coordinators may manually enter data into the Web survey. PDF versions of survey worksheets and GSS-eligible CIP code lists for reporting field of study are available for reference. The Web survey is the primary mode of data submission.
Based on the review of respondent data and explanatory comments provided by the respondents, follow-up telephone calls are made, or e-mails are sent to clarify responses, if needed.
Data processing
All data submitted by institution coordinators are reviewed to ensure that data fields are complete, and that data are internally consistent. Data that are substantially different from previously reported data are flagged for review by the survey contractor. If additional information or corrections are needed, institution coordinators are contacted by telephone or e-mail and are asked to correct and resubmit the survey data.
Estimation techniques
The survey is a census of eligible units; therefore, weighting for sampling is not applicable. Imputation rather than weighting is used to adjust for unit nonresponse; imputation is also used for item nonresponse.
Survey Quality Measures
Sampling error.
Not applicable because the GSS is a census.
Coverage error
Due to the availability of comprehensive lists of the master’s- and doctorate-granting institutions in the United States and the high level of participation in the survey of eligible institutions, coverage error is minimal. The universe of higher education institutions is regularly reviewed to identify new potentially eligible institutions.
Nonresponse error
The GSS typically has high response rates. In 2022, 98.7% of units provided complete or partial data and the overall institutional response rate was 95.8%.
Measurement error
Potential sources of measurement errors include double counting by units that offer joint programs, reporting of graduate students working toward practitioner degrees (particularly in health fields), difficulty in reporting of financial support data, difficulty in distinguishing NFRs from postdocs and other types of researchers employed in the units, and coordinators not including in their upload files all eligible CIP codes that are offered at their institution. Measurement error is minimized by reviewing data to identify inconsistent or implausible values and contacting coordinators to correct data as needed.
Data Availability and Comparability
Data availability.
NCSES has collected graduate enrollment and postdoc data for SEH fields since 1966. Not all data items were collected from all institutions in all survey years, and eligibility criteria for institutions and fields have undergone periodic revision. Starting in 2017, most respondents began uploading separate master’s and doctoral data using CIP codes. For these reasons, separate enrollment data for master’s and doctoral programs are available only for 2017 and later years. Notes are available in the latest trend data tables to explain changes the GSS has undergone over the years to support trend analysis.
Data comparability
The 2022 data are comparable to the 2021 data. In 2020, the list of GSS-eligible CIP codes was updated to align with the revised 2020 CIP list and NCSES Taxonomy of Disciplines. Most of the new CIP codes represented fields already reported to the GSS. For more information on these changes, see table A-17, table A-18a, and table A-18b in the “ Technical Notes ” section of the 2020 survey cycle.
The GSS made additional edits to the taxonomy based on data reporting patterns that emerged due to the 2017 redesign. These changes did not have a major impact on field of study or research because these changes did not impact the eligibility of fields for the survey. For comparisons to data prior to 2017, see the section: Data Comparability in the 2017 Technical Notes . A set of bridge estimates was created to permit comparisons to previous years and for trend analyses. These estimates are labeled 2017old and are available at the broad field level for all combined graduate student variables as well as postdoc variables. Due to a large increase in counts attributable to prior underreporting, 2017old estimates are not available for NFR data. The data reported as 2017new use the updated GSS taxonomy and are comparable to data since 2018 but are not comparable to data from prior years. Please note that in tables that compare data from 2017 to the present, the 2017new data are reported as 2017.
NCSES encourages analysts intending to do trend analyses to contact the GSS Survey Manager for additional information. For details on the historical changes, see the “Technical Information” section that accompanies the GSS data tables .
Data Products
Publications.
NCSES releases the data from this survey annually through analysis and data tables found at the GSS homepage . The information from this survey is also included in Science and Engineering Indicators and Diversity and STEM: Women, Minorities, and Persons with Disabilities .
NCSES includes selected data items from this survey for individual doctorate-granting institutions in the Academic Institution Profiles series.
Electronic access
Data for the years 1972–2022 are available as public use files . The file organization makes each year’s institution, school, and organizational unit data available in a single record.
Tabular data for recent years are available in NCSES’s interactive data tool ; historical data will be added on a continuous basis until the full 1972–2022 series is complete. Users can create custom tables of the number of graduate students, number of postdocs, or number of NFRs.
Technical Notes
Data collection and processing methods, data comparability, definitions.
Purpose. The Survey of Graduate Students and Postdoctorates in Science and Engineering (GSS) is an annual census of all academic institutions in the United States and its territories (Guam and Puerto Rico) granting research-based master’s degrees or doctorates in science, engineering, and selected health (SEH) fields as of the fall of the survey year. Sponsored by the National Center for Science and Engineering Statistics (NCSES) within the National Science Foundation (NSF) and by the National Institutes of Health (NIH), the GSS collects counts of graduate students, postdoctoral researchers (postdocs), and doctorate-holding nonfaculty researchers (NFRs) at these institutions by field, demographic characteristics, and other characteristics, such as source and mechanism of financial support. Results are used to assess shifts in graduate enrollment, shifts in postdoc and NFR appointments, and trends in financial support.
Data collection authority. The information collected by the GSS is solicited under the authority of the National Science Foundation Act of 1950, as amended, and the America COMPETES Reauthorization Act of 2010. The Office of Management and Budget (OMB) control number is 3145-0062 and expires on 31 August 2023.
Survey contractor . RTI International.
Survey sponsors. NCSES and NIH.
Frequency . Annual.
Initial survey year. 1966.
Reference period. Fall 2022.
Response unit . Organizational units (e.g., academic departments, degree-granting programs, university-affiliated research centers, and health care facilities) in academic institutions.
Sample or census. Census.
Population size . A total of 22,519 organizational units at 690 academic institutions.
Sample size . Not applicable.
Target population . The survey target population is all academic institutions in the United States and its territories (Guam and Puerto Rico) that grant research-based master’s or doctorate degrees in SEH fields. A research-based graduate degree program requires the training in, and conducting of, independent research as part of the curriculum. SEH fields are defined using the Integrated Postsecondary Education Data System (IPEDS) Classification of Instructional Programs (CIP) codes. This population includes branch campuses, affiliated research centers and health facilities, and separately organized components, such as medical or dental schools, schools of nursing, and schools of public health.
In 2022, the survey universe included 690 institutions with 775 schools and 22,519 organizational units. There were 502 schools and 20,698 units within 417 institutions awarding master’s or doctoral degrees and 273 schools and 1,821 units within 273 institutions that only award master’s degrees. Data were collected at the organizational-unit level. Detailed information on the changes to the survey universe and final number of institutions, schools, and units is provided in table A-1 through table A-5b .
Sampl ing frame. The total universe in 2022 included 22,519 units at 690 academic institutions in the United States that granted research-based master’s degrees or doctorates in SEH fields. Eligible academic institutions are identified primarily through IPEDS.
Sample design. The GSS is a census.
Data collection. The survey data are collected through coordinators at eligible institutions. Coordinators are assigned by their institution and are responsible for identifying all GSS-eligible units, collecting the requested data, and submitting the data to the survey contractor. GSS eligibility for SEH units is determined by the CIP code associated with the organizational unit. The GSS maintains a crosswalk between CIP codes and eligible SEH fields.
Coordinators query their institutional databases and report data through a file upload. Those unable to provide file uploads can manually enter data into the GSS Web survey. In cases where coordinators are unable to obtain the requested data, coordinators may enlist the aid of others (unit respondents) in their reporting activity. Unit respondents are most commonly used to report detailed financial support data. Institutions may assign multiple coordinators. For example, an institution may have one coordinator for each school within the institution or may have separate coordinators for graduate student data and for postdoc and NFR data. When a new coordinator is needed, the president’s office at the institution is asked to designate as coordinator the person most knowledgeable about the graduate student or postdoc data.
Once coordinators are confirmed, they are provided access to the GSS Web survey. On request, hard copies of the survey worksheets and GSS-eligible code lists are also e-mailed to each coordinator as reference. Data are collected at the organizational-unit level (e.g., departments, degree-granting programs, research centers, and health facilities) and include field of study, demographic characteristics, and funding information for graduate students and postdocs.
Mode. Electronic data interchange is the primary mode of data submission. Coordinators unable to use this method could manually enter their data in the GSS Web survey.
Response rates. Response rates are calculated based on responses to the survey’s various data collection grids (graduate student and postdoc counts, by ethnicity and race; full-time graduate student and postdoc counts, by primary source or mechanism of support; counts of postdocs, by type of doctoral degree and primary mechanism of support; counts of postdocs, by type of doctoral degree and citizenship; counts of postdocs, by origin of doctoral degree; and counts of NFRs, by type of doctoral degree and sex).
- Unit response . In 2022, the GSS received complete responses from 19,112 of the 22,519 eligible organizational units (84.9%). An additional 3,115 organizational units (13.8%) were partial respondents. The remaining 292 organizational units (1.3%) were nonrespondents.
- School response . Of the 775 eligible schools, 742 schools (95.7%) were complete respondents, 4 schools (0.5%) were partial respondents, and 29 schools (3.7%) were nonrespondents.
- Institutional response . Institutional response rates were calculated using the same criteria for schools. Of the 690 eligible institutions, 660 institutions (95.7%) were complete respondents, 1 institution (0.1%) was a partial respondent, and 29 institutions (4.2%) were nonrespondents.
Data editing. Data quality is ensured by interactive edit checks built into the Web survey and by a comprehensive review after the coordinator submits the data. Data collection grids in the Web survey are prefilled with zeros. Respondents are asked to mark a checkbox if the unit does not have eligible data to report. If uploaded data for a unit only contain one type of student (e.g., the unit has master’s students but no doctoral students), the appropriate checkbox indicating no students to report is auto filled by the system for the relevant grid. Grids with a marked checkbox contributed to a complete response for the unit. Grids with unchanged, prefilled zeros and an unmarked checkbox disqualified the unit from complete response status.
The Web survey contains edit checks to verify that the data entered are internally consistent and within an expected range, often based on the respondent’s prior-year data. In 2017, aggregate school-level edit checks were introduced, replacing unit-level checks. Reported aggregate school-level data are compared to the previous year for part-time, full-time, and first-time, full-time students as well as for postdoc and NFR counts. The survey contractor reviews all data submitted by institutions to ensure that data fields are complete and internally consistent. The data collection team conducts a post-submission data review, whereby coordinators are asked to explain the discrepancy whenever counts differ substantially from those of the previous year. Follow-up with coordinators is also conducted when counts remain identical to the previous year and when there are notable changes to a school’s unit list, including unit additions and deletions, changes to the highest-degree-granted status, GSS code, or unit name.
On the basis of follow-up contacts, necessary revisions are made directly in the Web survey by the coordinator, unit respondents, or the survey contractor at the direction of the coordinator. See section “ Survey Quality Measures ” below for a discussion of the types of measurement error detected in the data review and follow-up process.
Imputation. The 2022 GSS collected 543 data items related to enrollment and financial support for master’s and doctoral full-time and part-time students, postdocs, and NFRs. Of the 543 data items collected in the GSS, the item imputation rates ranged from 1.23% to 5.74%. All missing data were imputed.
Different imputation techniques were used for units with and for those without comparable historical data. For units missing a key total (total full-time master’s, full-time doctoral, part-time master’s, and part-time doctoral students; total postdocs; or total NFRs) with at least 1 year of qualified historical data, a carry-forward imputation method was used. Inflation factors were calculated for the six key totals to account for year-to-year change. The previous year’s key totals were carried forward as the imputed values for the current year’s key totals and imputed according to the previous year’s proportions.
For units that reported totals but no details, details were imputed according to the prior distribution if qualified historical details were available. Otherwise, a nearest-neighbor imputation method was used. In this method, a donor unit that was “nearest” to the unit whose data were being imputed (imputee) was identified among all responding units having similar characteristics as the imputee (e.g., having the same GSS code for program fields and offering a doctoral degree).
Similarly, when postdoc or NFR details were imputed, the total number of postdocs or NFRs, respectively, was used to choose the nearest neighbor. If the postdoc or NFR total was missing, the graduate student totals were used to select the nearest neighbor to impute the postdoc or NFR variables. If either the postdoc or NFR key total (or both) was missing, other available key totals were used to select the nearest neighbor to impute the data. The same donor was then used to impute the details corresponding to the imputed key totals.
For institutions or schools that did not respond, all data at the unit level were imputed. For these institutions or schools, if prior unit-level data were available, counts were carried forward; if no prior data were available, then the nearest-neighbor imputation method was used.
Detailed information on the institutions, schools, units, fields, response rates, imputation rates, and a crosswalk between the 2022 CIP codes and the GSS codes are provided in 17 technical tables for the 2022 GSS, which include three tables with information on the taxonomy change.
Weighting. Not applicable.
Variance estimation. Not applicable.
Sampling error. Not applicable because the GSS is a census.
Coverage error. Due to the availability of comprehensive lists of the master’s- and doctorate-granting institutions in the United States and the high level of participation in the survey of the eligible institutions, coverage error is minimal. The universe of higher education institutions is reviewed annually to identify potentially eligible institutions. Sources for this review include IPEDS, the Carnegie Classification of Institutions of Higher Education, the Higher Education Directory, the NCSES Higher Education Research and Development Survey, and professional association membership lists.
Nonresponse error. The GSS typically has high response rates. In 2022, 98.7% of units provided complete or partial data and the overall institutional response rate was 95.8%. Of the 543 data items collected in the GSS, the item imputation rates ranged from 1.23% to 5.74%. All missing data are imputed.
Measurement error. The GSS is subject to measurement error that arises when variables of interest cannot be measured accurately or precisely. Review of the data, cognitive interviews, usability tests, pilot tests, site visits, and other methodological activities with the institutions have pointed to several possible sources of measurement error. The types of measurement errors listed below are believed to have a minimal impact on data quality.
- Double counting. Anecdotal evidence indicates some misreporting may occur when an institution has more than one coordinator or offers joint programs. To reduce double counting, facilitate communication, and allow sharing of reported data, a screen in the Web survey provides names and contact information for all coordinators at the institution. Interactive and post-submission checks are also used to confirm that similarly named units within institutions are distinct eligible units. The introduction of data uploads has minimized this type of measurement error. This issue is now flagged for fewer than 0.5% of units reported to the GSS annually.
- Inclusion of practitioner degrees. Graduate students working toward practitioner degrees, particularly in health fields with explicit exclusions, may sometimes be overreported. Starting with the 2007 survey cycle, survey materials indicated that students should be excluded from the counts if they are pursuing DDS or MD degrees or master’s and certain other degrees in specified fields. During the imputation process—and to be conservative in the absence of other information—new units that were suspected of having reported graduate students in excluded degree-field programs based on the GSS code were set to having zero graduate students. In the 2011 survey cycle, checks were built into the Web survey to remind respondents to exclude students pursuing practitioner-based degrees. The 2017 redesign included a requirement that coordinators confirm via a pop-up dialog that they excluded practitioner degrees from the data provided in their upload files. Prior to the introduction of this pop-up dialog, it was more common to mistakenly include graduate students earning practitioner degrees. However, since the redesign in 2017, fewer than 0.5% of units that report doctoral students mistakenly included students pursuing practitioner degrees.
- Difficulty in reporting source and mechanism of support. Feedback from respondents and methodological research indicates that financial support data are often difficult for respondents to report. The information may not be stored in one centralized database; financial support may not always be channeled through the institution (e.g., self-support); and foreign sources of support may not always be known. Respondents may also have difficulty categorizing financial information by field, such as when a student is enrolled in one unit but receives support from another. Therefore, these data may be more prone to measurement error than other survey data items. Finally, institutions define mechanisms of support differently (e.g., fellowships vs. traineeships) and may report individuals according to the institution’s definition rather than that provided by the GSS. Beginning with the 2010 survey, the postdoc grids include “unknown” categories. Nonresponse rates for source and mechanism of support items typically range between 1% to 7% for graduate students and 4% to 5% for postdocs.
- Difficulty in reporting postdocs and NFRs. Many respondents indicate in the Web survey that they are unable to provide data on their units’ postdocs or NFRs because they do not know all of the units that employ postdocs and NFRs. Starting with the 2010 survey cycle, schools were given the option of appointing a separate postdoc coordinator who may be more knowledgeable about a school’s postdocs or NFRs to provide these data. In 2018, coordinators were given the ability to indicate that they had postdocs or NFRs but were unable to report them. The percentage of coordinators that select this option is generally less than 2% for postdoc data and 3% for NFR data since the option was added in 2018.
Changes in survey coverage and population .
- Eligibility and f ields of study .
2020: Starting in GSS 2020, the list of GSS-eligible CIP codes was updated to align with the revised 2020 CIP list and NCSES Taxonomy of Disciplines (TOD). Since most coordinators report graduate student data using CIP, it was important that GSS update the taxonomy to include the new CIP codes on the same timeline as IPEDS. As part of this update, new CIP codes were added, some CIP codes were changed, and a small number of CIP codes were removed. Most of the changes in CIP eligibility were made to ensure that the implementation of the new CIP codes included programs that were GSS-eligible and likely were being reported (based on unit names). The GSS codes of data science and data analytics and of medical clinical sciences were added for reporting new CIP codes in these fields. Due to changes in the CIP and TOD, veterinary biomedical and clinical sciences were moved from other health to agricultural sciences (renamed agricultural and veterinary sciences). To improve alignment with the TOD, human development moved from social sciences to psychology.
In addition to the adjustments made due to the changes in CIP and TOD, the GSS made additional changes based on data reporting patterns that emerged due to the 2017 redesign. Generally, these changes created more detailed fields out of larger GSS codes or reorganized existing codes to align with current enrollment patterns. Broad fields were added to engineering for the first time. In some cases, GSS codes with a small number of graduate students were combined for reporting purposes. For more information on these changes, see GSS 2020 : tables A-17 , A-18a , and A-18b .
2017: The list of GSS-eligible disciplinary fields was updated in 2017 to align with the TOD. Among the major changes in the update: several fields became ineligible—architecture, communications, and public administration; portions of nutrition and of family and consumer sciences and human sciences also became ineligible. Several fields changed names. A new broad field titled natural resources and conservation was split from agricultural sciences. Computer sciences was split into three fields, and the biological and biomedical sciences field was reorganized. The taxonomy changes resulted in previously reported units being split across separate GSS codes or moving between codes or broad fields. For more information on the 2017 taxonomy updates, see GSS 2017: table A-1 .
2014: The survey frame was updated following a comprehensive frame evaluation study. The study identified potentially eligible but not previously surveyed academic institutions in the United States with master’s- or doctorate-granting programs in SEH. Eligible units at 151 newly eligible institutions were added, and 2 private, for-profit institutions offering mostly practitioner-based graduate degrees were determined to be ineligible. An additional 4 institutions dropped out of the data collection in 2014 because they no longer grant graduate degrees in SEH fields, 2 merged with previously eligible institutions, and 1 began reporting data under another institution. As a result, the total number of institutions included in the GSS increased from 564 in 2013 to 706 in 2014. The total net increase in the number of GSS-eligible units was 826, rising to 14,845 in 2014 from 14,019 in 2013. See GSS 2014: table A-1 .
For more information on the survey frame update, see the Special Report Assessing the Impact of Frame Changes on Trend Data from the Survey of Graduate Students and Postdoctorates in Science and Engineering .
- Eligibility and degree-granting status .
Institutions are classified as doctorate-granting if at least one GSS-eligible unit confers doctoral degrees. In 2022, seven institutions became ineligible for the GSS. The 2022 survey cycle also saw four institutions merge into a single institution, combining a Health Science Center campus with that of the university’s main campus. In addition, 12 institutions changed GSS degree-granting status: 2 from doctorate-granting to master’s-granting institutions, and 10 from master’s-granting to doctorate-granting institutions. As a result, the total number of institutions included in the GSS decreased from 699 in 2021 to 690 in 2022 (see table A-2 for details on institutional status and table A-3 for overall number of institution counts).
Changes in survey content.
2010: Began collecting ethnicity, race, and citizenship data on postdocs by sex and began collecting type of doctoral degree data on NFRs by sex.
2008: Began collecting the number of first-time, full-time male graduate students by ethnicity and race; full-time male graduate students by source of support; male postdocs by source of support; and male NFRs. Previously, the number of men was inferred by subtracting the number of women from the total.
- Ethnicity and race .
2010: Began collecting ethnicity and race data for postdocs who are U.S. citizens and permanent residents using the same categories as used for graduate students.
2008: Revised ethnicity and race categories to correspond to IPEDS by combining “Hispanic/Latino, one race only” and “Hispanic/Latino, more than one race” categories into “Hispanic or Latino (one or more races).”
- Citizenship .
2010: Began collecting citizenship data on postdocs using the same categories that are used for graduate students. In previous years, only counts of postdocs who are foreign nationals holding temporary visas were collected.
2008: Clarification made for “non-U.S. citizens” to exclude non-U.S. citizens residing outside of the United States who are enrolled in an online degree program at a U.S. institution.
- Financial support .
2010: Began collecting data on the largest source of financial support and on the largest mechanism of support separately for postdocs. For mechanism of support, “nonfederal sources” was replaced with “other support.”
2008: Graduate student data no longer collected for NIH teaching assistantships because NIH does not offer financial support for students through this mechanism.
2008: Began collecting the number of full-time graduate students whose largest source of support came from a non-U.S. source via teaching assistantship.
- Degree l evel .
2017: Began separate collection of demographic and financial data by master’s and doctoral students.
- Doctoral degree.
2010: Began collecting more detailed information on postdocs’ and NFRs’ doctoral degree type. Categories were added for those holding a doctoral degree (e.g., PhD, ScD, DEng), a professional degree (e.g., MD, DVM, DO, DDS), and dual degrees (e.g., MD-PhD, DVM-PhD) as well as for those whom type of degree was unknown. In previous years, the GSS collected degree-type information by asking respondents to indicate how many of the total number of postdocs (or NFRs) had MD, DO, DDS, or DVM degrees. This number was used to estimate the number of postdocs (or NFRs) with medical degrees; the number with research degrees was estimated as the difference between the total counts and the counts of those with medical degrees.
2010: Began collecting postdocs’ doctoral degree type by citizenship and by country of origin (United States, foreign, unknown) of doctoral degrees. Also began collecting NFRs’ doctoral degree type by sex.
Changes in survey procedures .
2017: Coordinators were asked to report master’s and doctoral student data separately and to use CIP codes to categorize their organizational units when reporting student data. Coordinators could report organizational units with postdocs and NFRs using either CIP or GSS codes. Two alternative methods for uploading GSS data were expected of coordinators in 2017. The first option enabled coordinators to utilize an Excel template file to construct a de-identified, individual-level data file. This file could then be uploaded directly into the Web survey. The second option enabled the coordinator to aggregate the individual-level data to the unit level using an Excel macro provided in the template file rather than transmit any individual-level data. A manual data entry option was available to those unable to provide an uploaded file. Coordinators had access to data file templates, a sample SQL SELECT statement containing all GSS-eligible CIP codes that could be used to query their information systems, online training videos, and additional support from the survey contractor on the new data collection changes. Coordinators could continue to use unit respondents to provide part or all of the data request. Organizational units that reported using CIP codes were automatically re-coded to the updated GSS taxonomy by the Web instrument. Coordinators reporting data using GSS rather than CIP codes were asked to re-code their organizational units to the updated GSS taxonomy.
2010: Significant effort was made to ensure that appropriate personnel were providing postdoc and NFR data. As a result, it is unclear how much of the increase reported in 2010 represented actual growth in postdocs and how much resulted from improved data collection. For information on the improved data collection and changes in postdoc data, see Counts of Postdoctoral Appointees in Science, Engineering, and Health Rise with Reporting Improvements ; for changes in NFR data, see Examining the Reporting of Nonfaculty Doctorate Researchers in the Survey of Graduate Students and Postdoctorates in Science and Engineering .
Historical changes . Changes have been made over the years to the coverage and content of the GSS to keep it relevant to the needs of data users. Such changes impact analysis of trend data, so data comparisons across years should be made with caution. This is especially true for counts; however, proportions or shares are typically robust enough to allow for such comparisons.
In 2017, due to the taxonomy and data collection changes (described above), a set of bridge estimates was created to permit comparisons to previous years and for trend analyses. These estimates are labeled 2017old and are available at the broad field level for all combined graduate student variables as well as postdoc variables. Due to a large increase in counts attributable to prior underreporting, 2017old estimates are not available for NFR data. The data reported as 2017new use the updated GSS taxonomy and are comparable to 2018–21 data but are not comparable to data from prior years. Please note that in tables that compare data from 2017 to the present that 2017new data are used.
Due to the survey frame update, the data comparisons between 2014 and earlier years should use the 2014old data, and those between 2014 and 2016 should use the 2014new data. The impact of frame updates can be evaluated using the 2014old and 2014new data. For more information on the survey frame update, see the Special Report Assessing the Impact of Frame Changes on Trend Data from the Survey of Graduate Students and Postdoctorates in Science and Engineering . For more information on the changes prior to 2010, see Graduate Students and Postdoctorates in Science and Engineering: Fall 2009 : “Technical Notes” section. For specific changes from the major survey redesign in 2007, see the 2007 report: “Technical Notes.”
Degree level.
- Master’s degree . A post-baccalaureate, research-focused degree; includes MA, MS, MASc, and PSM in GSS-eligible disciplines.
- PhD or PhD equivalent d egree . An advanced, research-focused academic degree—typically, the highest degree granted in a particular field; includes doctorates such as PhD, ScD, DSc, and DEng.
Enrollment status.
- Full time and part time . Coordinators were instructed to use their institution’s definitions.
- First time, full time. Students enrolled for credit in a graduate degree program in an organizational unit for the first time in the fall semester of the survey year. This may include graduate students previously enrolled in another graduate degree program at the institution or at another institution and students who already hold another graduate or professional degree.
Ethnicity and race . The GSS uses definitions of ethnicity and race that are based on the OMB’s Standards for the Classification of Feder al Data on Race and Ethnicity.
- Hispanic or Latino ethnicity (one or more races) . The OMB standards designate Hispanics as an ethnic group rather than a racial group. Following these standards, Hispanic is not counted as a race in GSS. Cognitive interviews with respondents showed this was a source of considerable confusion. For example, prior to 2008 Black Hispanics and White Hispanics could be counted as “Hispanic, More than one race” rather than “Only one race, Hispanic.” The ethnicity and race categories were aligned to IPEDS by combining the “Hispanic/Latino, More than one race” and “Hispanic/Latino, One race only” categories. In 2008, these two Hispanic categories were collapsed into one: “Hispanic or Latino ethnicity (one or more races).” The OMB standards designate Hispanics as an ethnic group rather than a racial group. Following these standards, Hispanic is not counted as a race in GSS. Cognitive interviews with respondents showed this was a source of considerable confusion. For example, prior to 2008 Black Hispanics and White Hispanics could be counted as “Hispanic, More than one race” rather than “Only one race, Hispanic.” The ethnicity and race categories were aligned to IPEDS by combining the “Hispanic/Latino, More than one race” and “Hispanic/Latino, One race only” categories. In 2008, these two Hispanic categories were collapsed into one: “Hispanic or Latino ethnicity (one or more races).” The OMB standards designate Hispanics as an ethnic group rather than a racial group. Following these standards, Hispanic is not counted as a race in GSS. Cognitive interviews with respondents showed this was a source of considerable confusion. For example, prior to 2008 Black Hispanics and White Hispanics could be counted as “Hispanic, More than one race” rather than “Only one race, Hispanic.” The ethnicity and race categories were aligned to IPEDS by combining the “Hispanic/Latino, More than one race” and “Hispanic/Latino, One race only” categories. In 2008, these two Hispanic categories were collapsed into one: “Hispanic or Latino ethnicity (one or more races).” All individuals of Cuban, Mexican, Puerto Rican, South or Central American, or other Spanish culture or origin, regardless of race. This category includes individuals who are Hispanic or Latino and any other race.
- Not Hispanic or Latino . Individuals who are not of Hispanic or Latino descent, regardless of race.
- American Indian or Alaska Native . A person of only one race having origins in any of the original peoples of North and South America (including Central America) and who maintains tribal affiliation or community attachment.
- Asian . A person of only one race having origins in any of the original peoples of the Far East, Southeast Asia, or the Indian subcontinent—for example, Cambodia, China, India, Japan, Korea, Malaysia, Pakistan, the Philippine Islands, Thailand, and Vietnam.
- Black or African American . A person of only one race having origins in any of the Black racial groups of Africa.
- Native Hawaiian or Other Pacific Islander . A person of only one race having origins in any of the original peoples of Hawaii, Guam, Samoa, or other Pacific islands.
- White . A person of only one race having origins in any of the original peoples of Europe, the Middle East, or North Africa.
- More than one race . A person of two or more of the race categories listed above.
- Unknown ethnicity or race . A person whose ethnicity or race is unknown or not stated.
Graduate student mechanisms of financial support .
- Fellowship . A competitive award (often from a national competition) given to a graduate student that requires no work by the recipient.
- Traineeship . A financial award given to a graduate student selected by the institution.
- Research assistantship . A financial award given to a graduate student for which most of the student’s responsibilities are devoted primarily to research.
- Teaching assistantship . A financial award given to a graduate student for which most of the student’s responsibilities are devoted primarily to teaching assistant activities.
- Other support . All other mechanisms of support for graduate students.
Graduate student sources of financial support .
- Federal sources . Financial support provided by U.S. federal agencies. Excludes federally guaranteed student loans.
- Nonfederal sources . Financial support from state and local governments; support from the institution, such as tuition waivers and stipends; support from foreign sources, such as foreign governments, foreign firms, and agencies of the United Nations; and other U.S. sources, such as support from nonprofit institutions, private industry, and all other nonfederal U.S. sources.
- Self-support . Loans (including federal loans) or personal or family financial contributions.
Historically B lack colleges and universities (HBCUs) . Institutions of higher education that were established prior to 1964 and whose principal mission was, and is, the education of Black Americans. The list of HBCUs is maintained by the White House Initiative on HBCUs ( https://sites.ed.gov/whhbcu/ ).
Nonfaculty researchers (NFRs) . All doctorate-holding researchers who (1) are not considered either postdocs or members of the faculty and (2) are involved principally in SEH research activities. Also referred to as Other doctorate-holding NFR s .
Postdoctoral researchers (postdocs) . The definition of a postdoc varies by institution. Respondents were instructed to use their institution’s definition. NCSES defines a postdoc as meeting both of the following qualifications: (1) holds a recent doctoral degree, generally awarded within the past 5–7 years, such as PhD or equivalent (e.g., ScD, DEng), or first-professional degree in a medical or related field (e.g., MD, DDS, DO, DVM), or foreign degree equivalent to a U.S. doctoral degree; and (2) has a limited-term appointment, generally no more than 5–7 years, primarily for training in research or scholarship, and working under the supervision of a senior scholar in a unit affiliated with the institution.
Postdoc mechanisms of financial support .
- Traineeship . A financial award given to a postdoc selected by the institution.
- Research grant . A financial assistance award given to an organization or an individual postdoc that supports specific research goals.
- Other support . All other mechanisms of support for postdocs.
Postdoc sources of financial support .
- Federal sources . Financial support provided by U.S. federal agencies.
- Nonfederal sources . Financial support from state and local governments; support from the institution; support from foreign sources, such as foreign governments, foreign firms, and agencies of the United Nations; and other U.S. sources, such as support from nonprofit institutions, private industry, and all other nonfederal U.S. sources.
- Personal resources . Personal and family financial resources, including federal and other loans.
- Unknown or not stated . Sources of financial support for the postdoc are unknown or cannot be determined.
Technical Tables
Questionnaires, view archived questionnaires, key data tables.
Recommended data tables
Trends over time
Demographic characteristics: 2022, financial support: 2022, fields of study: 2022, data tables, institutional characteristics: 2022, general notes.
This report presents data from the 2022 Survey of Graduate Students and Postdoctorates in Science and Engineering (GSS). The GSS is an annual census of all U.S. academic institutions granting research-based master’s degrees or doctorates in science, engineering, and selected health (SEH) fields as of fall of the survey year. Results are used to assess shifts in graduate enrollment, shifts in appointments of postdoctoral researchers (postdocs) and doctorate-level nonfaculty researchers (NFRs), and trends in financial support.
The GSS is sponsored by the National Center for Science and Engineering Statistics within the National Science Foundation and by the National Institutes of Health.
The tables in this report provide detailed data on master's and doctoral graduate students and postdocs in SEH fields. Trend data are provided on enrollment, postdocs, and NFRs, as well as counts of master’s and doctoral students, postdocs, and NFRs by characteristics, such as sex, ethnicity, race, citizenship, field of study or research, and primary source and mechanism of support.
Acknowledgments and Suggested Citation
Acknowledgments, suggested citation.
Michael Yamaner of the National Center for Science and Engineering Statistics (NCSES) developed and coordinated this report under the guidance of Amber Levanon Seligson, NCSES Program Director, and the leadership of Emilda B. Rivers, NCSES Director; Christina Freyman, NCSES Deputy Director; and John Finamore, NCSES Chief Statistician. Wan-Ying Chang (NCSES) reviewed the report. Under contract to NCSES, RTI International compiled the tables in this report.
NCSES thanks the institutions and coordinators for their participation in the GSS.
National Center for Science and Engineering Statistics (NCSES). 2024. Survey of Graduate Students and Postdoctorates in Science and Engineering . NSF 24-319. Alexandria, VA: National Science Foundation. Available at https://ncses.nsf.gov/surveys/graduate-students-postdoctorates-s-e/2022 .
Featured Analysis
Ncses data explorer, related content, related collections, survey contact.
For additional information about this survey or the methodology, contact
Get e-mail updates from NCSES
NCSES is an official statistical agency. Subscribe below to receive our latest news and announcements.
IMAGES
VIDEO
COMMENTS
2. Alchemer. As a platform with lots of advanced question types and a reasonable cost, Alchemer is an excellent tool for academic research. Question types include MaxDiff, conjoint, semantic differential, image heat map, text highlighter, continuous sum, cascading dropdowns, rankings, and card grouping.
SurveySparrow - Best User Experience. The SurveySparrow Survey Tool is a simple to use, automated survey tool created by a team of researchers and application developers. The SurveySparrow Survey Tool has many benefits for academic users and scientific researchers due to its simplicity, power, and flexibility.
4. SurveyMonkey. SurveyMonkey is a widely recognized and user-friendly online survey tool that caters to various users, including academic researchers, businesses, and organizations. It provides a range of features for creating and distributing surveys, collecting responses, and analyzing data.
1. Introduction. Online survey or questionnaire-based studies collect information from participants responding to the study link using internet-based communication technology (e.g. E-mail, online survey platform). There has been a growing interest among researchers for using internet-based data collection methods during the COVID-19 pandemic ...
6 top-rated survey tools. Here's a summary of the best survey tools for research that can help you find the insights you need. 1. Jotform. Jotform's Form Builder is easy to use, and our no-code survey building solutions are customizable and simple to integrate, even for customers with limited technical experience. In addition, responses ...
Survey Monkey is an academic research survey software that allows users to create, distribute, and analyze surveys. The software is web-based and offers a variety of features, including templates, question types, and skip logic. Survey Monkey offers a free plan for small surveys and a paid plan for more extensive surveys.
QuestionPro Academic license gives access to a variety of online survey questions and advanced online survey tools for academic research. Online surveys for survey research are very easy to create and guaranteed will deliver the results you're looking to achieve. We understand what an important role online surveys for academic research play in educational projects, thus through QuestionPro ...
Online surveys are critical to examine population samples so hypotheses can be proved or disregarded. While methods and techniques may vary, QuestionPro survey software is an excellent academic research tool for conducting online surveys. QuestionPro's robust suite of research tools provides you with all you need to derive research results.
Online surveys are a popular choice for students doing dissertation research, due to the low cost and flexibility of this method. There are many online tools available for constructing surveys, such as SurveyMonkey and Google Forms. You can quickly access a large sample without constraints on time or location. The data is easy to process and ...
7. SurveyMonkey - Best for AI-powered academic surveys. SurveyMonkey is a versatile academic software that allows researchers in academia to conduct surveys for various purposes, including testing hypotheses and gathering data on attitudes and behaviors in domains such as business, politics, and health.
ABSTRACT. Fully qualitative surveys, which prioritise qualitative research values, and harness the rich potential of qualitative data, have much to offer qualitative researchers, especially given online delivery options. Yet the method remains underutilised, and there is little in the way of methodological discussion of qualitative surveys. Underutilisation and limited methodological ...
Get in Touch. An online Survey tool for Academic Researchers to collect answers from our online audience panel for poll-based surveys, image-based surveys, scenario-based surveys, conditional surveys, long surveys, and supervisor-subordinate surveys.
Grammarly. Grammarly is a real-time writing tool that checks spelling, punctuation, and style. It was created in 2009 by linguists and software engineers and is now one of the most popular writing tools. Grammarly is available as a browser extension, a desktop program for Windows and macOS, and a web app.
Students, faculty, and professionals conduct academic surveys as part of their research projects. An academic survey is a tool designed to obtain more knowledge and data about a chosen subject. The results are used to answer questions or confirm hypotheses posed by the researchers. Surveys results can then be the basis of your research report ...
Online Surveys. Online Surveys is a tool provide by Jisc and designed for use in academic research. Available to University staff and students. To obtain an account contact the Planning and Strategy Office. Qualtrics. Qualtrics is an online survey tool widely used in academic research. Available to Henley Business School and Agriculture, Policy ...
Surveys and questionnaires can be used across every discipline and responses collected using varying methodologies. With our online survey tool you can download your results ready for including in your thesis or export data to excel for further analysis. Whichever methodology you choose, our student survey software is a convenient, affordable ...
The online survey tool designed for Academic Research, Education and Public Sector organisations. Surveys are an everyday part of education and research; from gathering organisational data or capturing research evidence, right through to analysing results and creating impact in presenting your findings.
However, with a tool like SurveySparrow, creating, sharing, and analyzing the results of academic research surveys is a simple walk in the park. Browse through our free survey templates that have all popular surveys for market research , employee engagement, customer satisfaction and the likes.
We're making diverse, high-quality data available to anyone, anywhere. Prolific was created by researchers, for researchers. Our rigorous and ethical approach means we deliver higher data quality for online behavioural research than all our competitors. About Prolific. Trusted for 9 years by leading academics, researchers, and organisations.
Online Audience Panel. SurveySparrow's academic research software provides an online panel of audience, belonging to diverse demographics and backgrounds. Find the right audience for your research work and get the correct answers using SurveySparrow. Kick-start your academic research work with SurveySparrow's academic research software.
Next, send a request to [email protected] to renew your discount. Start your free academic account today! Join the strongest brands on the planet. Take advantage of Sogolytics's free academic license and discount plans and get a professional survey tool for academic research, course evaluations, and more. Sign up today!
Qualtrics survey software was launched in 2002 as a way for academics to carry out sophisticated research that previously, online survey tools had been unable to handle because of the complex needs of academic research. It brought to the market advanced survey functionality and analytics that would previously have taken researchers weeks and ...
REDCap is a secure web application for building and managing online surveys and databases. While REDCap can be used to collect virtually any type of data in any environment (including compliance with 21 CFR Part 11, FISMA, HIPAA, and GDPR), it is specifically geared to support online and offline data capture for research studies and operations.
The following are recommended as starting points among the databases for finding literature reviews: Annual Reviews offers authoritative syntheses of the primary research literature in 46 academic fields, including anthropology, economics, law, political science, and sociology. Find literature reviews in various databases by using the filters ...
The Survey of Graduate Students and Postdoctorates in Science and Engineering (GSS) is an annual census of all academic institutions in the United States and its territories (Guam and Puerto Rico) granting research-based master's degrees or doctorates in science, engineering, and selected health (SEH) fields as of the fall of the survey year.