
Qualitative Data Coding 101
How to code qualitative data, the smart way (with examples).
By: Jenna Crosley (PhD) | Reviewed by:Dr Eunice Rautenbach | December 2020
As we’ve discussed previously , qualitative research makes use of non-numerical data – for example, words, phrases or even images and video. To analyse this kind of data, the first dragon you’ll need to slay is qualitative data coding (or just “coding” if you want to sound cool). But what exactly is coding and how do you do it?
Overview: Qualitative Data Coding
In this post, we’ll explain qualitative data coding in simple terms. Specifically, we’ll dig into:
- What exactly qualitative data coding is
- What different types of coding exist
- How to code qualitative data (the process)
- Moving from coding to qualitative analysis
- Tips and tricks for quality data coding

What is qualitative data coding?
Let’s start by understanding what a code is. At the simplest level, a code is a label that describes the content of a piece of text. For example, in the sentence:
“Pigeons attacked me and stole my sandwich.”
You could use “pigeons” as a code. This code simply describes that the sentence involves pigeons.
So, building onto this, qualitative data coding is the process of creating and assigning codes to categorise data extracts. You’ll then use these codes later down the road to derive themes and patterns for your qualitative analysis (for example, thematic analysis ). Coding and analysis can take place simultaneously, but it’s important to note that coding does not necessarily involve identifying themes (depending on which textbook you’re reading, of course). Instead, it generally refers to the process of labelling and grouping similar types of data to make generating themes and analysing the data more manageable.
Makes sense? Great. But why should you bother with coding at all? Why not just look for themes from the outset? Well, coding is a way of making sure your data is valid . In other words, it helps ensure that your analysis is undertaken systematically and that other researchers can review it (in the world of research, we call this transparency). In other words, good coding is the foundation of high-quality analysis.

What are the different types of coding?
Now that we’ve got a plain-language definition of coding on the table, the next step is to understand what overarching types of coding exist – in other words, coding approaches . Let’s start with the two main approaches, inductive and deductive .
With deductive coding, you, as the researcher, begin with a set of pre-established codes and apply them to your data set (for example, a set of interview transcripts). Inductive coding on the other hand, works in reverse, as you create the set of codes based on the data itself – in other words, the codes emerge from the data. Let’s take a closer look at both.
Deductive coding 101
With deductive coding, we make use of pre-established codes, which are developed before you interact with the present data. This usually involves drawing up a set of codes based on a research question or previous research . You could also use a code set from the codebook of a previous study.
For example, if you were studying the eating habits of college students, you might have a research question along the lines of
“What foods do college students eat the most?”
As a result of this research question, you might develop a code set that includes codes such as “sushi”, “pizza”, and “burgers”.
Deductive coding allows you to approach your analysis with a very tightly focused lens and quickly identify relevant data . Of course, the downside is that you could miss out on some very valuable insights as a result of this tight, predetermined focus.

Inductive coding 101
But what about inductive coding? As we touched on earlier, this type of coding involves jumping right into the data and then developing the codes based on what you find within the data.
For example, if you were to analyse a set of open-ended interviews , you wouldn’t necessarily know which direction the conversation would flow. If a conversation begins with a discussion of cats, it may go on to include other animals too, and so you’d add these codes as you progress with your analysis. Simply put, with inductive coding, you “go with the flow” of the data.
Inductive coding is great when you’re researching something that isn’t yet well understood because the coding derived from the data helps you explore the subject. Therefore, this type of coding is usually used when researchers want to investigate new ideas or concepts , or when they want to create new theories.

A little bit of both… hybrid coding approaches
If you’ve got a set of codes you’ve derived from a research topic, literature review or a previous study (i.e. a deductive approach), but you still don’t have a rich enough set to capture the depth of your qualitative data, you can combine deductive and inductive methods – this is called a hybrid coding approach.
To adopt a hybrid approach, you’ll begin your analysis with a set of a priori codes (deductive) and then add new codes (inductive) as you work your way through the data. Essentially, the hybrid coding approach provides the best of both worlds, which is why it’s pretty common to see this in research.
Need a helping hand?
How to code qualitative data
Now that we’ve looked at the main approaches to coding, the next question you’re probably asking is “how do I actually do it?”. Let’s take a look at the coding process , step by step.
Both inductive and deductive methods of coding typically occur in two stages: initial coding and line by line coding .
In the initial coding stage, the objective is to get a general overview of the data by reading through and understanding it. If you’re using an inductive approach, this is also where you’ll develop an initial set of codes. Then, in the second stage (line by line coding), you’ll delve deeper into the data and (re)organise it according to (potentially new) codes.
Step 1 – Initial coding
The first step of the coding process is to identify the essence of the text and code it accordingly. While there are various qualitative analysis software packages available, you can just as easily code textual data using Microsoft Word’s “comments” feature.
Let’s take a look at a practical example of coding. Assume you had the following interview data from two interviewees:
What pets do you have?
I have an alpaca and three dogs.
Only one alpaca? They can die of loneliness if they don’t have a friend.
I didn’t know that! I’ll just have to get five more.
I have twenty-three bunnies. I initially only had two, I’m not sure what happened.
In the initial stage of coding, you could assign the code of “pets” or “animals”. These are just initial, fairly broad codes that you can (and will) develop and refine later. In the initial stage, broad, rough codes are fine – they’re just a starting point which you will build onto in the second stage.

How to decide which codes to use
But how exactly do you decide what codes to use when there are many ways to read and interpret any given sentence? Well, there are a few different approaches you can adopt. The main approaches to initial coding include:
- In vivo coding
Process coding
- Open coding
Descriptive coding
Structural coding.
- Value coding
Let’s take a look at each of these:
In vivo coding
When you use in vivo coding , you make use of a participants’ own words , rather than your interpretation of the data. In other words, you use direct quotes from participants as your codes. By doing this, you’ll avoid trying to infer meaning, rather staying as close to the original phrases and words as possible.
In vivo coding is particularly useful when your data are derived from participants who speak different languages or come from different cultures. In these cases, it’s often difficult to accurately infer meaning due to linguistic or cultural differences.
For example, English speakers typically view the future as in front of them and the past as behind them. However, this isn’t the same in all cultures. Speakers of Aymara view the past as in front of them and the future as behind them. Why? Because the future is unknown, so it must be out of sight (or behind us). They know what happened in the past, so their perspective is that it’s positioned in front of them, where they can “see” it.
In a scenario like this one, it’s not possible to derive the reason for viewing the past as in front and the future as behind without knowing the Aymara culture’s perception of time. Therefore, in vivo coding is particularly useful, as it avoids interpretation errors.
Next up, there’s process coding , which makes use of action-based codes . Action-based codes are codes that indicate a movement or procedure. These actions are often indicated by gerunds (words ending in “-ing”) – for example, running, jumping or singing.
Process coding is useful as it allows you to code parts of data that aren’t necessarily spoken, but that are still imperative to understanding the meaning of the texts.
An example here would be if a participant were to say something like, “I have no idea where she is”. A sentence like this can be interpreted in many different ways depending on the context and movements of the participant. The participant could shrug their shoulders, which would indicate that they genuinely don’t know where the girl is; however, they could also wink, showing that they do actually know where the girl is.
Simply put, process coding is useful as it allows you to, in a concise manner, identify the main occurrences in a set of data and provide a dynamic account of events. For example, you may have action codes such as, “describing a panda”, “singing a song about bananas”, or “arguing with a relative”.

Descriptive coding aims to summarise extracts by using a single word or noun that encapsulates the general idea of the data. These words will typically describe the data in a highly condensed manner, which allows the researcher to quickly refer to the content.
Descriptive coding is very useful when dealing with data that appear in forms other than traditional text – i.e. video clips, sound recordings or images. For example, a descriptive code could be “food” when coding a video clip that involves a group of people discussing what they ate throughout the day, or “cooking” when coding an image showing the steps of a recipe.
Structural coding involves labelling and describing specific structural attributes of the data. Generally, it includes coding according to answers to the questions of “ who ”, “ what ”, “ where ”, and “ how ”, rather than the actual topics expressed in the data. This type of coding is useful when you want to access segments of data quickly, and it can help tremendously when you’re dealing with large data sets.
For example, if you were coding a collection of theses or dissertations (which would be quite a large data set), structural coding could be useful as you could code according to different sections within each of these documents – i.e. according to the standard dissertation structure . What-centric labels such as “hypothesis”, “literature review”, and “methodology” would help you to efficiently refer to sections and navigate without having to work through sections of data all over again.
Structural coding is also useful for data from open-ended surveys. This data may initially be difficult to code as they lack the set structure of other forms of data (such as an interview with a strict set of questions to be answered). In this case, it would useful to code sections of data that answer certain questions such as “who?”, “what?”, “where?” and “how?”.
Let’s take a look at a practical example. If we were to send out a survey asking people about their dogs, we may end up with a (highly condensed) response such as the following:
Bella is my best friend. When I’m at home I like to sit on the floor with her and roll her ball across the carpet for her to fetch and bring back to me. I love my dog.
In this set, we could code Bella as “who”, dog as “what”, home and floor as “where”, and roll her ball as “how”.
Values coding
Finally, values coding involves coding that relates to the participant’s worldviews . Typically, this type of coding focuses on excerpts that reflect the values, attitudes, and beliefs of the participants. Values coding is therefore very useful for research exploring cultural values and intrapersonal and experiences and actions.
To recap, the aim of initial coding is to understand and familiarise yourself with your data , to develop an initial code set (if you’re taking an inductive approach) and to take the first shot at coding your data . The coding approaches above allow you to arrange your data so that it’s easier to navigate during the next stage, line by line coding (we’ll get to this soon).
While these approaches can all be used individually, it’s important to remember that it’s possible, and potentially beneficial, to combine them . For example, when conducting initial coding with interviews, you could begin by using structural coding to indicate who speaks when. Then, as a next step, you could apply descriptive coding so that you can navigate to, and between, conversation topics easily.
Step 2 – Line by line coding
Once you’ve got an overall idea of our data, are comfortable navigating it and have applied some initial codes, you can move on to line by line coding. Line by line coding is pretty much exactly what it sounds like – reviewing your data, line by line, digging deeper and assigning additional codes to each line.
With line-by-line coding, the objective is to pay close attention to your data to add detail to your codes. For example, if you have a discussion of beverages and you previously just coded this as “beverages”, you could now go deeper and code more specifically, such as “coffee”, “tea”, and “orange juice”. The aim here is to scratch below the surface. This is the time to get detailed and specific so as to capture as much richness from the data as possible.
In the line-by-line coding process, it’s useful to code everything in your data, even if you don’t think you’re going to use it (you may just end up needing it!). As you go through this process, your coding will become more thorough and detailed, and you’ll have a much better understanding of your data as a result of this, which will be incredibly valuable in the analysis phase.

Moving from coding to analysis
Once you’ve completed your initial coding and line by line coding, the next step is to start your analysis . Of course, the coding process itself will get you in “analysis mode” and you’ll probably already have some insights and ideas as a result of it, so you should always keep notes of your thoughts as you work through the coding.
When it comes to qualitative data analysis, there are many different types of analyses (we discuss some of the most popular ones here ) and the type of analysis you adopt will depend heavily on your research aims, objectives and questions . Therefore, we’re not going to go down that rabbit hole here, but we’ll cover the important first steps that build the bridge from qualitative data coding to qualitative analysis.
When starting to think about your analysis, it’s useful to ask yourself the following questions to get the wheels turning:
- What actions are shown in the data?
- What are the aims of these interactions and excerpts? What are the participants potentially trying to achieve?
- How do participants interpret what is happening, and how do they speak about it? What does their language reveal?
- What are the assumptions made by the participants?
- What are the participants doing? What is going on?
- Why do I want to learn about this? What am I trying to find out?
- Why did I include this particular excerpt? What does it represent and how?

Code categorisation
Categorisation is simply the process of reviewing everything you’ve coded and then creating code categories that can be used to guide your future analysis. In other words, it’s about creating categories for your code set. Let’s take a look at a practical example.
If you were discussing different types of animals, your initial codes may be “dogs”, “llamas”, and “lions”. In the process of categorisation, you could label (categorise) these three animals as “mammals”, whereas you could categorise “flies”, “crickets”, and “beetles” as “insects”. By creating these code categories, you will be making your data more organised, as well as enriching it so that you can see new connections between different groups of codes.
Theme identification
From the coding and categorisation processes, you’ll naturally start noticing themes. Therefore, the logical next step is to identify and clearly articulate the themes in your data set. When you determine themes, you’ll take what you’ve learned from the coding and categorisation and group it all together to develop themes. This is the part of the coding process where you’ll try to draw meaning from your data, and start to produce a narrative . The nature of this narrative depends on your research aims and objectives, as well as your research questions (sounds familiar?) and the qualitative data analysis method you’ve chosen, so keep these factors front of mind as you scan for themes.

Tips & tricks for quality coding
Before we wrap up, let’s quickly look at some general advice, tips and suggestions to ensure your qualitative data coding is top-notch.
- Before you begin coding, plan out the steps you will take and the coding approach and technique(s) you will follow to avoid inconsistencies.
- When adopting deductive coding, it’s useful to use a codebook from the start of the coding process. This will keep your work organised and will ensure that you don’t forget any of your codes.
- Whether you’re adopting an inductive or deductive approach, keep track of the meanings of your codes and remember to revisit these as you go along.
- Avoid using synonyms for codes that are similar, if not the same. This will allow you to have a more uniform and accurate coded dataset and will also help you to not get overwhelmed by your data.
- While coding, make sure that you remind yourself of your aims and coding method. This will help you to avoid directional drift , which happens when coding is not kept consistent.
- If you are working in a team, make sure that everyone has been trained and understands how codes need to be assigned.

Psst... there’s more!
This post was based on one of our popular Research Bootcamps . If you're working on a research project, you'll definitely want to check this out ...
You Might Also Like:

31 Comments

I appreciated the valuable information provided to accomplish the various stages of the inductive and inductive coding process. However, I would have been extremely satisfied to be appraised of the SPECIFIC STEPS to follow for: 1. Deductive coding related to the phenomenon and its features to generate the codes, categories, and themes. 2. Inductive coding related to using (a) Initial (b) Axial, and (c) Thematic procedures using transcribe data from the research questions

Thank you so much for this. Very clear and simplified discussion about qualitative data coding.

This is what I want and the way I wanted it. Thank you very much.

All of the information’s are valuable and helpful. Thank for you giving helpful information’s. Can do some article about alternative methods for continue researches during the pandemics. It is more beneficial for those struggling to continue their researchers.

Thank you for your information on coding qualitative data, this is a very important point to be known, really thank you very much.

Very useful article. Clear, articulate and easy to understand. Thanks

This is very useful. You have simplified it the way I wanted it to be! Thanks

Thank you so very much for explaining, this is quite helpful!

hello, great article! well written and easy to understand. Can you provide some of the sources in this article used for further reading purposes?

You guys are doing a great job out there . I will not realize how many students you help through your articles and post on a daily basis. I have benefited a lot from your work. this is remarkable.

Wonderful one thank you so much.

Hello, I am doing qualitative research, please assist with example of coding format.

This is an invaluable website! Thank you so very much!

Well explained and easy to follow the presentation. A big thumbs up to you. Greatly appreciate the effort 👏👏👏👏

Thank you for this clear article with examples

Thank you for the detailed explanation. I appreciate your great effort. Congrats!

Ahhhhhhhhhh! You just killed me with your explanation. Crystal clear. Two Cheers!

D0 you have primary references that was used when creating this? If so, can you share them?

Being a complete novice to the field of qualitative data analysis, your indepth analysis of the process of thematic analysis has given me better insight. Thank you so much.

Excellent summary

Thank you so much for your precise and very helpful information about coding in qualitative data.

Thanks a lot to this helpful information. You cleared the fog in my brain.

Glad to hear that!

This has been very helpful. I am excited and grateful.

I still don’t understand the coding and categorizing of qualitative research, please give an example on my research base on the state of government education infrastructure environment in PNG

Wahho, this is amazing and very educational to have come across this site.. from a little search to a wide discovery of knowledge.
Thanks I really appreciate this.

Thank you so much! Very grateful.

This was truly helpful. I have been so lost, and this simplified the process for me.

Just at the right time when I needed to distinguish between inductive and
deductive data analysis of my Focus group discussion results very helpful

Very useful across disciplines and at all levels. Thanks…
Submit a Comment Cancel reply
Your email address will not be published. Required fields are marked *
Save my name, email, and website in this browser for the next time I comment.
- Print Friendly
University Library, University of Illinois at Urbana-Champaign

Qualitative Data Analysis: Coding
- Atlas.ti web
- R for text analysis
- Microsoft Excel & spreadsheets
- Other options
- Planning Qual Data Analysis
- Free Tools for QDA
- QDA with NVivo
- QDA with Atlas.ti
- QDA with MAXQDA
- PKM for QDA
- QDA with Quirkos
- Working Collaboratively
- Qualitative Methods Texts
- Transcription
- Data organization
- Example Publications
Coding Qualitative Data
Planning your coding strategy.
Coding is a qualitative data analysis strategy in which some aspect of the data is assigned a descriptive label that allows the researcher to identify related content across the data. How you decide to code - or whether to code- your data should be driven by your methodology. But there are rarely step-by-step descriptions, and you'll have to make many decisions about how to code for your own project.
Some questions to consider as you decide how to code your data:
What will you code?
What aspects of your data will you code? If you are not coding all of your available data, how will you decide which elements need to be coded? If you have recordings interviews or focus groups, or other types of multimedia data, will you create transcripts to analyze and code? Or will you code the media itself (see Farley, Duppong & Aitken, 2020 on direct coding of audio recordings rather than transcripts).
Where will your codes come from?
Depending on your methodology, your coding scheme may come from previous research and be applied to your data (deductive). Or you my try to develop codes entirely from the data, ignoring as much as possible, previous knowledge of the topic under study, to develop a scheme grounded in your data (inductive). In practice, however, many practices will fall between these two approaches.
How will you apply your codes to your data?
You may decide to use software to code your qualitative data, to re-purpose other software tools (e.g. Word or spreadsheet software) or work primarily with physical versions of your data. Qualitative software is not strictly necessary, though it does offer some advantages, like:
- Codes can be easily re-labeled, merged, or split. You can also choose to apply multiple coding schemes to the same data, which means you can explore multiple ways of understanding the same data. Your analysis, then, is not limited by how often you are able to work with physical data, such as paper transcripts.
- Most software programs for QDA include the ability to export and import coding schemes. This means you can create a re-use a coding scheme from a previous study, or that was developed in outside of the software, without having to manually create each code.
- Some software for QDA includes the ability to directly code image, video, and audio files. This may mean saving time over creating transcripts. Or, your coding may be enhanced by access to the richness of mediated content, compared to transcripts.
- Using QDA software may also allow you the ability to use auto-coding functions. You may be able to automatically code all of the statements by speaker in a focus group transcript, for example, or identify and code all of the paragraphs that include a specific phrase.
What will be coded?
Will you deploy a line-by-line coding approach, with smaller codes eventually condensed into larger categories or concepts? Or will you start with codes applied to larger segments of the text, perhaps later reviewing the examples to explore and re-code for differences between the segments?
How will you explain the coding process?
- Regardless of how you approach coding, the process should be clearly communicated when you report your research, though this is not always the case (Deterding & Waters, 2021).
- Carefully consider the use of phrases like "themes emerged." This phrasing implies that the themes lay passively in the data, waiting for the researcher to pluck them out. This description leaves little room for describing how the researcher "saw" the themes and decided which were relevant to the study. Ryan and Bernard (2003) offer a terrific guide to ways that you might identify themes in the data, using both your own observations as well as manipulations of the data.
How will you report the results of your coding process?
How you report your coding process should align with the methodology you've chosen. Your methodology may call for careful and consistent application of a coding scheme, with reports of inter-rater reliability and counts of how often a code appears within the data. Or you may use the codes to help develop a rich description of an experience, without needing to indicate precisely how often the code was applied.
How will you code collaboratively?
If you are working with another researcher or a team, your coding process requires careful planning and implementation. You will likely need to have regular conversations about your process, particularly if your goal is to develop and consistently apply a coding scheme across your data.
Coding Features in QDA Software Programs
- Atlas.ti (Mac)
- Atlas.ti (Windows)
- NVivo (Windows)
- NVivo (Mac)
- Coding data See how to create and manage codes and apply codes to segments of the data (known as quotations in Atlas.ti).
- Search and Code Using the search and code feature lets you locate and automatically code data through text search, regular expressions, Named Entity Recognition, and Sentiment Analysis.
- Focus Group Coding Properly prepared focus group documents can be automatically coded by speaker.
- Inter-Coder Agreement Coded text, audio, and video documents can be tested for inter-coder agreement. ICA is not available for images or PDF documents.
- Quotation Reader Once you've coded data, you can view just the data that has been assigned that code.
- Find Redundant Codings (Mac) This tool identifies "overlapping or embedded" quotations that have the same code, that are the result of manual coding or errors when merging project files.
- Coding Data in Atlas.ti (Windows) Demonstrates how to create new codes, manage codes and applying codes to segments of the data (known as quotations in Atlas.ti)
- Search and Code in Atlas.ti (Windows) You can use a text search, regular expressions, Named Entity Recognition, and Sentiment Analysis to identify and automatically code data in Atlas.ti.
- Focus Group Coding in Atlas.ti (Windows) Properly prepared focus group transcripts can be automatically coded by speaker.
- Inter-coder Agreement in Atlas.ti (Windows) Coded text, audio, and video documents can be tested for inter-coder agreement. ICA is not available for images or PDF documents.
- Quotation Reader in Atlas.ti (Windows) Once you've coded data, you can view and export the quotations that have been assigned that code.
- Find Redundant Codings in Atlas.ti (Windows) This tool identifies "overlapping or embedded" quotations that have the same code, that are the result of manual coding or errors when merging project files.
- Coding in NVivo (Windows) This page includes an overview of the coding features in NVivo.
- Automatic Coding in Documents in NVivo (Windows) You can use paragraph formatting styles or speaker names to automatically format documents.
- Coding Comparison Query in NVivo (Windows) You can use the coding comparison feature to compare how different users have coded data in NVivo.
- Review the References in a Node in NVivo (Windows) References are the term that NVivo uses for coded segments of the data. This shows you how to view references related to a code (or any node)
- Text Search Queries in NVivo (Windows) Text queries let you search for specific text in your data. The results of your query can be saved as a node (a form of auto coding).
- Coding Query in NVivo (Windows) Use a coding query to display references from your data for a single code or multiples of codes.
- Code Files and Manage Codes in NVivo (Mac) This page offers an overview of coding features in NVivo. Note that NVivo uses the concept of a node to refer to any structure around which you organize your data. Codes are a type of node, but you may see these terms used interchangeably.
- Automatic Coding in Datasets in NVivo (Mac) A dataset in NVivo is data that is in rows and columns, as in a spreadsheet. If a column is set to be codable, you can also automatically code the data. This approach could be used for coding open-ended survey data.
- Text Search Query in NVivo (Mac) Use the text search query to identify relevant text in your data and automatically code references by saving as a node.
- Review the References in a Node in NVivo (Mac) NVivo uses the term references to refer to data that has been assigned to a code or any node. You can use the reference view to see the data linked to a specific node or combination of nodes.
- Coding Comparison Query in NVivo (Mac) Use the coding comparison query to calculate a measure of inter-rater reliability when you've worked with multiple coders.
The MAXQDA interface is the same across Mac and Windows devices.
- The "Code System" in MAXQDA This section of the manual shows how to create and manage codes in MAXQDA's code system.
- How to Code with MAXQDA
- Display Coded Segments in the Document Browser Once you've coded a document within MAXQDA, you can choose which of those codings will appear on the document, as well as choose whether or not the text is highlighted in the color linked to the code.
- Creative Coding in MAXQDA Use the creative coding feature to explore the relationships between codes in your system. If you develop a new structure to you codes that you like, you can apply the changes to your overall code scheme.
- Text Search in MAXQDA Use a Text Search to identify data that matches your search terms and automatically code the results. You can choose whether to code only the matching results, the sentence the results are in, or the paragraph the results appear in.
- Segment Retrieval in MAXQDA Data that has been coded is considered a segment. Segment retrieval is how you display the segments that match a code or combination of codes. You can use the activation feature to show only the segments from a document group, or that match a document variable.
- Intercorder Agreement in MAXQDA MAXQDA includes the ability to compare coding between two coders on a single project.
- Create Tags in Taguette Taguette uses the term tag to refer to codes. You can create single tags as well as a tag hierarchy using punctuation marks.
- Highlighting in Taguette Select text with a document (a highlight) and apply tags to code data in Taguette.
Useful Resources on Coding

Deterding, N. M., & Waters, M. C. (2021). Flexible coding of in-depth interviews: A twenty-first-century approach. Sociological Methods & Research , 50 (2), 708–739. https://doi.org/10.1177/0049124118799377
Farley, J., Duppong Hurley, K., & Aitken, A. A. (2020). Monitoring implementation in program evaluation with direct audio coding. Evaluation and Program Planning , 83 , 101854. https://doi.org/10.1016/j.evalprogplan.2020.101854
Ryan, G. W., & Bernard, H. R. (2003). Techniques to identify themes. Field Methods , 15 (1), 85–109. https://doi.org/10.1177/1525822X02239569.
- << Previous: Data organization
- Next: Citations >>
- Last Updated: Apr 5, 2024 2:23 PM
- URL: https://guides.library.illinois.edu/qualitative
A guide to coding qualitative research data
Last updated
12 February 2023
Reviewed by
Each time you ask open-ended and free-text questions, you'll end up with numerous free-text responses. When your qualitative data piles up, how do you sift through it to determine what customers value? And how do you turn all the gathered texts into quantifiable and actionable information related to your user's expectations and needs?
Qualitative data can offer significant insights into respondents’ attitudes and behavior. But to distill large volumes of text / conversational data into clear and insightful results can be daunting. One way to resolve this is through qualitative research coding.
Streamline data coding
Use global data tagging systems in Dovetail so everyone analyzing research is speaking the same language
- What is coding in qualitative research?
This is the system of classifying and arranging qualitative data . Coding in qualitative research involves separating a phrase or word and tagging it with a code. The code describes a data group and separates the information into defined categories or themes. Using this system, researchers can find and sort related content.
They can also combine categorized data with other coded data sets for analysis, or analyze it separately. The primary goal of coding qualitative data is to change data into a consistent format in support of research and reporting.
A code can be a phrase or a word that depicts an idea or recurring theme in the data. The code’s label must be intuitive and encapsulate the essence of the researcher's observations or participants' responses. You can generate these codes using two approaches to coding qualitative data: manual coding and automated coding.
- Why is it important to code qualitative data?
By coding qualitative data, it's easier to identify consistency and scale within a set of individual responses. Assigning codes to phrases and words within feedback helps capture what the feedback entails. That way, you can better analyze and understand the outcome of the entire survey.
Researchers use coding and other qualitative data analysis procedures to make data-driven decisions according to customer responses. Coding in customer feedback will help you assess natural themes in the customers’ language. With this, it's easy to interpret and analyze customer satisfaction .
- How do inductive and deductive approaches to qualitative coding work?
Before you start qualitative research coding, you must decide whether you're starting with some predefined code frames, within which the data will be sorted (deductive approach). Or, you may plan to develop and evolve the codes while reviewing the qualitative data generated by the research (inductive approach). A combination of both approaches is also possible.
In most instances, a combined approach will be best. For example, researchers will have some predefined codes/themes they expect to find in the data, but will allow for a degree of discovery in the data where new themes and codes come to light.
Inductive coding
This is an exploratory method in which new data codes and themes are generated by the review of qualitative data. It initiates and generates code according to the source of the data itself. It's ideal for investigative research, in which you devise a new idea, theory, or concept.
Inductive coding is otherwise called open coding. There's no predefined code-frame within inductive coding, as all codes are generated by reviewing the raw qualitative data.
If you're adding a new code, changing a code descriptor, or dividing an existing code in half, ensure you review the wider code frame to determine whether this alteration will impact other feedback codes. Failure to do this may lead to similar responses at various points in the qualitative data, generating different codes while containing similar themes or insights.
Inductive coding is more thorough and takes longer than deductive coding, but offers a more unbiased and comprehensive overview of the themes within your data.
Deductive coding
This is a hierarchical approach to coding. In this method, you develop a codebook using your initial code frames. These frames may depend on an ongoing research theory or questions. Go over the data once again and filter data to different codes.
After generating your qualitative data, your codes must be a match for the code frame you began with. Program evaluation research could use this coding approach.
Inductive and deductive approaches
Research studies usually blend both inductive and deductive coding approaches. For instance, you may use a deductive approach for your initial set of code sets, and later use an inductive approach to generate fresh codes and recalibrate them while you review and analyze your data.
- What are the practical steps for coding qualitative data?
You can code qualitative data in the following ways:
1. Conduct your first-round pass at coding qualitative data
You need to review your data and assign codes to different pieces in this step. You don't have to generate the right codes since you will iterate and evolve them ahead of the second-round coding review.
Let's look at examples of the coding methods you may use in this step.
Open coding : This involves the distilling down of qualitative data into separate, distinct coded elements.
Descriptive coding : In this method, you create a description that encapsulates the data section’s content. Your code name must be a noun or a term that describes what the qualitative data relates to.
Values coding : This technique categorizes qualitative data that relates to the participant's attitudes, beliefs, and values.
Simultaneous coding : You can apply several codes to a single piece of qualitative data using this approach.
Structural coding : In this method, you can classify different parts of your qualitative data based on a predetermined design to perform additional analysis within the design.
In Vivo coding : Use this as the initial code to represent specific phrases or single words generated via a qualitative interview (i.e., specifically what the respondent said).
Process coding : A process of coding which captures action within data. Usually, this will be in the form of gerunds ending in “ing” (e.g., running, searching, reviewing).
2. Arrange your qualitative codes into groups and subcodes
You can start organizing codes into groups once you've completed your initial round of qualitative data coding. There are several ways to arrange these groups.
You can put together codes related to one another or address the same subjects or broad concepts, under each category. Continue working with these groups and rearranging the codes until you develop a framework that aligns with your analysis.
3. Conduct more rounds of qualitative coding
Conduct more iterations of qualitative data coding to review the codes and groups you've already established. You can change the names and codes, combine codes, and re-group the work you've already done during this phase.
In contrast, the initial attempt at data coding may have been hasty and haphazard. But these coding rounds focus on re-analyzing, identifying patterns, and drawing closer to creating concepts and ideas.
Below are a few techniques for qualitative data coding that are often applied in second-round coding.
Pattern coding : To describe a pattern, you join snippets of data, similarly classified under a single umbrella code.
Thematic analysis coding : When examining qualitative data, this method helps to identify patterns or themes.
Selective coding/focused coding : You can generate finished code sets and groups using your first pass of coding.
Theoretical coding : By classifying and arranging codes, theoretical coding allows you to create a theoretical framework's hypothesis. You develop a theory using the codes and groups that have been generated from the qualitative data.
Content analysis coding : This starts with an existing theory or framework and uses qualitative data to either support or expand upon it.
Axial coding : Axial coding allows you to link different codes or groups together. You're looking for connections and linkages between the information you discovered in earlier coding iterations.
Longitudinal coding : In this method, by organizing and systematizing your existing qualitative codes and categories, it is possible to monitor and measure them over time.
Elaborative coding : This involves applying a hypothesis from past research and examining how your present codes and groups relate to it.
4. Integrate codes and groups into your concluding narrative
When you finish going through several rounds of qualitative data coding and applying different forms of coding, use the generated codes and groups to build your final conclusions. The final result of your study could be a collection of findings, theory, or a description, depending on the goal of your study.
Start outlining your hypothesis , observations , and story while citing the codes and groups that served as its foundation. Create your final study results by structuring this data.
- What are the two methods of coding qualitative data?
You can carry out data coding in two ways: automatic and manual. Manual coding involves reading over each comment and manually assigning labels. You'll need to decide if you're using inductive or deductive coding.
Automatic qualitative data analysis uses a branch of computer science known as Natural Language Processing to transform text-based data into a format that computers can comprehend and assess. It's a cutting-edge area of artificial intelligence and machine learning that has the potential to alter how research and insight is designed and delivered.
Although automatic coding is faster than human coding, manual coding still has an edge due to human oversight and limitations in terms of computer power and analysis.
- What are the advantages of qualitative research coding?
Here are the benefits of qualitative research coding:
Boosts validity : gives your data structure and organization to be more certain the conclusions you are drawing from it are valid
Reduces bias : minimizes interpretation biases by forcing the researcher to undertake a systematic review and analysis of the data
Represents participants well : ensures your analysis reflects the views and beliefs of your participant pool and prevents you from overrepresenting the views of any individual or group
Fosters transparency : allows for a logical and systematic assessment of your study by other academics
- What are the challenges of qualitative research coding?
It would be best to consider theoretical and practical limitations while analyzing and interpreting data. Here are the challenges of qualitative research coding:
Labor-intensive: While you can use software for large-scale text management and recording, data analysis is often verified or completed manually.
Lack of reliability: Qualitative research is often criticized due to a lack of transparency and standardization in the coding and analysis process, being subject to a collection of researcher bias.
Limited generalizability : Detailed information on specific contexts is often gathered using small samples. Drawing generalizable findings is challenging even with well-constructed analysis processes as data may need to be more widely gathered to be genuinely representative of attitudes and beliefs within larger populations.
Subjectivity : It is challenging to reproduce qualitative research due to researcher bias in data analysis and interpretation. When analyzing data, the researchers make personal value judgments about what is relevant and what is not. Thus, different people may interpret the same data differently.
- What are the tips for coding qualitative data?
Here are some suggestions for optimizing the value of your qualitative research now that you are familiar with the fundamentals of coding qualitative data.
Keep track of your codes using a codebook or code frame
It can be challenging to recall all your codes offhand as you code more and more data. Keeping track of your codes in a codebook or code frame will keep you organized as you analyze the data. An Excel spreadsheet or word processing document might be your codebook's basic format.
Ensure you track:
The label applied to each code and the time it was first coded or modified
An explanation of the idea or subject matter that the code relates to
Who the original coder is
Any notes on the relationship between the code and other codes in your analysis
Add new codes to your codebook as you code new data, and rearrange categories and themes as necessary.
- How do you create high-quality codes?
Here are four useful tips to help you create high-quality codes.
1. Cover as many survey responses as possible
The code should be generic enough to aid your analysis while remaining general enough to apply to various comments. For instance, "product" is a general code that can apply to many replies but is also ambiguous.
Also, the specific statement, "product stops working after using it for 3 hours" is unlikely to apply to many answers. A good compromise might be "poor product quality" or "short product lifespan."
2. Avoid similarities
Having similar codes is acceptable only if they serve different objectives. While "product" and "customer service" differ from each other, "customer support" and "customer service" can be unified into a single code.
3. Take note of the positive and the negative
Establish contrasting codes to track an issue's negative and positive aspects separately. For instance, two codes to identify distinct themes would be "excellent customer service" and "poor customer service."
4. Minimize data—to a point
Try to balance having too many and too few codes in your analysis to make it as useful as possible.
What is the best way to code qualitative data?
Depending on the goal of your research, the procedure of coding qualitative data can vary. But generally, it entails:
Reading through your data
Assigning codes to selected passages
Carrying out several rounds of coding
Grouping codes into themes
Developing interpretations that result in your final research conclusions
You can begin by first coding snippets of text or data to summarize or characterize them and then add your interpretative perspective in the second round of coding.
A few techniques are more or less acceptable depending on your study’s goal; there is no right or incorrect way to code a data set.
What is an example of a code in qualitative research?
A code is, at its most basic level, a label specifying how you should read a text. The phrase, "Pigeons assaulted me and took my meal," is an illustration. You can use pigeons as a code word.
Is there coding in qualitative research?
An essential component of qualitative data analysis is coding. Coding aims to give structure to free-form data so one can systematically study it.
Editor’s picks
Last updated: 11 January 2024
Last updated: 6 October 2023
Last updated: 25 November 2023
Last updated: 12 May 2023
Last updated: 15 February 2024
Last updated: 30 April 2024
Last updated: 18 May 2023
Last updated: 10 April 2023
Latest articles
Related topics, .css-je19u9{-webkit-align-items:flex-end;-webkit-box-align:flex-end;-ms-flex-align:flex-end;align-items:flex-end;display:-webkit-box;display:-webkit-flex;display:-ms-flexbox;display:flex;-webkit-flex-direction:row;-ms-flex-direction:row;flex-direction:row;-webkit-box-flex-wrap:wrap;-webkit-flex-wrap:wrap;-ms-flex-wrap:wrap;flex-wrap:wrap;-webkit-box-pack:center;-ms-flex-pack:center;-webkit-justify-content:center;justify-content:center;row-gap:0;text-align:center;max-width:671px;}@media (max-width: 1079px){.css-je19u9{max-width:400px;}.css-je19u9>span{white-space:pre;}}@media (max-width: 799px){.css-je19u9{max-width:400px;}.css-je19u9>span{white-space:pre;}} decide what to .css-1kiodld{max-height:56px;display:-webkit-box;display:-webkit-flex;display:-ms-flexbox;display:flex;-webkit-align-items:center;-webkit-box-align:center;-ms-flex-align:center;align-items:center;}@media (max-width: 1079px){.css-1kiodld{display:none;}} build next, decide what to build next.

Users report unexpectedly high data usage, especially during streaming sessions.

Users find it hard to navigate from the home page to relevant playlists in the app.

It would be great to have a sleep timer feature, especially for bedtime listening.

I need better filters to find the songs or artists I’m looking for.
Log in or sign up
Get started for free
- AI & NLP
- Churn & Loyalty
- Customer Experience
- Customer Journeys
- Customer Metrics
- Feedback Analysis
- Product Experience
- Product Updates
- Sentiment Analysis
- Surveys & Feedback Collection
- Try Thematic
Welcome to the community

Coding Qualitative Data: How to Code Qualitative Research
How many hours have you spent sitting in front of Excel spreadsheets trying to find new insights from customer feedback?
You know that asking open-ended survey questions gives you more actionable insights than asking your customers for just a numerical Net Promoter Score (NPS) . But when you ask open-ended, free-text questions, you end up with hundreds (or even thousands) of free-text responses.
How can you turn all of that text into quantifiable, applicable information about your customers’ needs and expectations? By coding qualitative data.
Keep reading to learn:
- What coding qualitative data means (and why it’s important)
- Different methods of coding qualitative data
- How to manually code qualitative data to find significant themes in your data
What is coding in qualitative research?
Coding is the process of labeling and organizing your qualitative data to identify different themes and the relationships between them.
When coding customer feedback , you assign labels to words or phrases that represent important (and recurring) themes in each response. These labels can be words, phrases, or numbers; we recommend using words or short phrases, since they’re easier to remember, skim, and organize.
Coding qualitative research to find common themes and concepts is part of thematic analysis . Thematic analysis extracts themes from text by analyzing the word and sentence structure.
Within the context of customer feedback, it's important to understand the many different types of qualitative feedback a business can collect, such as open-ended surveys, social media comments, reviews & more.
What is qualitative data analysis?
Qualitative data analysis is the process of examining and interpreting qualitative data to understand what it represents.
Qualitative data is defined as any non-numerical and unstructured data; when looking at customer feedback, qualitative data usually refers to any verbatim or text-based feedback such as reviews, open-ended responses in surveys , complaints, chat messages, customer interviews, case notes or social media posts
For example, NPS metric can be strictly quantitative, but when you ask customers why they gave you a rating a score, you will need qualitative data analysis methods in place to understand the comments that customers leave alongside numerical responses.
Methods of qualitative data analysis
Thematic analysis.
This refers to the uncovering of themes, by analyzing the patterns and relationships in a set of qualitative data. A theme emerges or is built when related findings appear to be meaningful and there are multiple occurences. Thematic analysis can be used by anyone to transform and organize open-ended responses, online reviews and other qualitative data into significant themes.
Content analysis:
This refers to the categorization, tagging and thematic analysis of qualitative data. Essentially content analysis is a quantification of themes, by counting the occurrence of concepts, topics or themes. Content analysis can involve combining the categories in qualitative data with quantitative data, such as behavioral data or demographic data, for deeper insights.
Narrative analysis:
Some qualitative data, such as interviews or field notes may contain a story on how someone experienced something. For example, the process of choosing a product, using it, evaluating its quality and decision to buy or not buy this product next time. The goal of narrative analysis is to turn the individual narratives into data that can be coded. This is then analyzed to understand how events or experiences had an impact on the people involved.
Discourse analysis:
This refers to analysis of what people say in social and cultural context. The goal of discourse analysis is to understand user or customer behavior by uncovering their beliefs, interests and agendas. These are reflected in the way they express their opinions, preferences and experiences. It’s particularly useful when your focus is on building or strengthening a brand , by examining how they use metaphors and rhetorical devices.
Framework analysis:
When performing qualitative data analysis, it is useful to have a framework to organize the buckets of meaning. A taxonomy or code frame (a hierarchical set of themes used in coding qualitative data) is an example of the result. Don't fall into the trap of starting with a framework to make it faster to organize your data. You should look at how themes relate to each other by analyzing the data and consistently check that you can validate that themes are related to each other .
Grounded theory:
This method of analysis starts by formulating a theory around a single data case. Therefore the theory is “grounded’ in actual data. Then additional cases can be examined to see if they are relevant and can add to the original theory.
Why is it important to code qualitative data?
Coding qualitative data makes it easier to interpret customer feedback. Assigning codes to words and phrases in each response helps capture what the response is about which, in turn, helps you better analyze and summarize the results of the entire survey.
Researchers use coding and other qualitative data analysis processes to help them make data-driven decisions based on customer feedback. When you use coding to analyze your customer feedback, you can quantify the common themes in customer language. This makes it easier to accurately interpret and analyze customer satisfaction.
What is thematic coding?
Thematic coding, also called thematic analysis, is a type of qualitative data analysis that finds themes in text by analyzing the meaning of words and sentence structure.
When you use thematic coding to analyze customer feedback for example, you can learn which themes are most frequent in feedback. This helps you understand what drives customer satisfaction in an accurate, actionable way.
To learn more about how Thematic analysis software helps you automate the data coding process, check out this article .
Automated vs. Manual coding of qualitative data
Methods of coding qualitative data fall into three categories: automated coding and manual coding, and a blend of the two.
You can automate the coding of your qualitative data with thematic analysis software . Thematic analysis and qualitative data analysis software use machine learning, artificial intelligence (AI) , and natural language processing (NLP) to code your qualitative data and break text up into themes.
Thematic analysis software is autonomous , which means…
- You don’t need to set up themes or categories in advance.
- You don’t need to train the algorithm — it learns on its own.
- You can easily capture the “unknown unknowns” to identify themes you may not have spotted on your own.
…all of which will save you time (and lots of unnecessary headaches) when analyzing your customer feedback.
Businesses are also seeing the benefit of using thematic analysis software. The capacity to aggregate data sources into a single source of analysis helps to break down data silos, unifying the analysis and insights across departments . This is now being referred to as Omni channel analysis or Unified Data Analytics .
Use Thematic Analysis Software
Try Thematic today to discover why leading companies rely on the platform to automate the coding of qualitative customer feedback at scale. Whether you have tons of customer reviews, support chat or open-ended survey responses, Thematic brings every valuable insight to the surface, while saving you thousands of hours.
Advances in natural language processing & machine learning have made it possible to automate the analysis of qualitative data, in particular content and framework analysis. The most commonly used software for automated coding of qualitative data is text analytics software such as Thematic .
While manual human analysis is still popular due to its perceived high accuracy, automating most of the analysis is quickly becoming the preferred choice. Unlike manual analysis, which is prone to bias and doesn’t scale to the amount of qualitative data that is generated today, automating analysis is not only more consistent and therefore can be more accurate, but can also save a ton of time, and therefore money.
Our Theme Editor tool ensures you take a reflexive approach, an important step in thematic analysis. The drag-and-drop tool makes it easy to refine, validate, and rename themes as you get more data. By guiding the AI, you can ensure your results are always precise, easy to understand and perfectly aligned with your objectives.
Thematic is the best software to automate code qualitative feedback at scale.
Don't just take it from us. Here's what some of our customers have to say:
I'm a fan of Thematic's ability to save time and create heroes. It does an excellent job using a single view to break down the verbatims into themes displayed by volume, sentiment and impact on our beacon metric, often but not exclusively NPS.
It does a superlative job using GenAI in summarizing a theme or sub-theme down to a single paragraph making it clear what folks are trying to say. Peter K, Snr Research Manager.
Thematic is a very intuitive tool to use. It boasts a robust level of granularity, allowing the user to see the general breadth of verbatim themes, dig into the sub-themes, and further into the sentiment of the open text itself. Artem C, Sr Manager of Research. LinkedIn.
AI-powered software to transform qualitative data at scale through a thematic and content analysis.
How to manually code qualitative data
For the rest of this post, we’ll focus on manual coding. Different researchers have different processes, but manual coding usually looks something like this:
- Choose whether you’ll use deductive or inductive coding.
- Read through your data to get a sense of what it looks like. Assign your first set of codes.
- Go through your data line-by-line to code as much as possible. Your codes should become more detailed at this step.
- Categorize your codes and figure out how they fit into your coding frame.
- Identify which themes come up the most — and act on them.
Let’s break it down a little further…
Deductive coding vs. inductive coding
Before you start qualitative data coding, you need to decide which codes you’ll use.
What is Deductive Coding?
Deductive coding means you start with a predefined set of codes, then assign those codes to the new qualitative data. These codes might come from previous research, or you might already know what themes you’re interested in analyzing. Deductive coding is also called concept-driven coding.
For example, let’s say you’re conducting a survey on customer experience . You want to understand the problems that arise from long call wait times, so you choose to make “wait time” one of your codes before you start looking at the data.
The deductive approach can save time and help guarantee that your areas of interest are coded. But you also need to be careful of bias; when you start with predefined codes, you have a bias as to what the answers will be. Make sure you don’t miss other important themes by focusing too hard on proving your own hypothesis.
What is Inductive Coding?
Inductive coding , also called open coding, starts from scratch and creates codes based on the qualitative data itself. You don’t have a set codebook; all codes arise directly from the survey responses.
Here’s how inductive coding works:
- Break your qualitative dataset into smaller samples.
- Read a sample of the data.
- Create codes that will cover the sample.
- Reread the sample and apply the codes.
- Read a new sample of data, applying the codes you created for the first sample.
- Note where codes don’t match or where you need additional codes.
- Create new codes based on the second sample.
- Go back and recode all responses again.
- Repeat from step 5 until you’ve coded all of your data.
If you add a new code, split an existing code into two, or change the description of a code, make sure to review how this change will affect the coding of all responses. Otherwise, the same responses at different points in the survey could end up with different codes.
Sounds like a lot of work, right? Inductive coding is an iterative process, which means it takes longer and is more thorough than deductive coding. A major advantage is that it gives you a more complete, unbiased look at the themes throughout your data.
Combining inductive and deductive coding
In practice, most researchers use a blend of inductive and deductive approaches to coding.
For example, with Thematic, the AI inductively comes up with themes, while also framing the analysis so that it reflects how business decisions are made . At the end of the analysis, researchers use the Theme Editor to iterate or refine themes. Then, in the next wave of analysis, as new data comes in, the AI starts deductively with the theme taxonomy.
Categorize your codes with coding frames
Once you create your codes, you need to put them into a coding frame. A coding frame represents the organizational structure of the themes in your research. There are two types of coding frames: flat and hierarchical.
Flat Coding Frame
A flat coding frame assigns the same level of specificity and importance to each code. While this might feel like an easier and faster method for manual coding, it can be difficult to organize and navigate the themes and concepts as you create more and more codes. It also makes it hard to figure out which themes are most important, which can slow down decision making.
Hierarchical Coding Frame
Hierarchical frames help you organize codes based on how they relate to one another. For example, you can organize the codes based on your customers’ feelings on a certain topic:

In this example:
- The top-level code describes the topic (customer service)
- The mid-level code specifies whether the sentiment is positive or negative
- The third level details the attribute or specific theme associated with the topic
Hierarchical framing supports a larger code frame and lets you organize codes based on organizational structure. It also allows for different levels of granularity in your coding.
Whether your code frames are hierarchical or flat, your code frames should be flexible. Manually analyzing survey data takes a lot of time and effort; make sure you can use your results in different contexts.
For example, if your survey asks customers about customer service, you might only use codes that capture answers about customer service. Then you realize that the same survey responses have a lot of comments about your company’s products. To learn more about what people say about your products, you may have to code all of the responses from scratch! A flexible coding frame covers different topics and insights, which lets you reuse the results later on.
Tips for manually coding qualitative data
Now that you know the basics of coding your qualitative data, here are some tips on making the most of your qualitative research.
Use a codebook to keep track of your codes
As you code more and more data, it can be hard to remember all of your codes off the top of your head. Tracking your codes in a codebook helps keep you organized throughout the data analysis process. Your codebook can be as simple as an Excel spreadsheet or word processor document. As you code new data, add new codes to your codebook and reorganize categories and themes as needed.
Make sure to track:
- The label used for each code
- A description of the concept or theme the code refers to
- Who originally coded it
- The date that it was originally coded or updated
- Any notes on how the code relates to other codes in your analysis
How to create high-quality codes - 4 tips
1. cover as many survey responses as possible..
The code should be generic enough to apply to multiple comments, but specific enough to be useful in your analysis. For example, “Product” is a broad code that will cover a variety of responses — but it’s also pretty vague. What about the product? On the other hand, “Product stops working after using it for 3 hours” is very specific and probably won’t apply to many responses. “Poor product quality” or “short product lifespan” might be a happy medium.
2. Avoid commonalities.
Having similar codes is okay as long as they serve different purposes. “Customer service” and “Product” are different enough from one another, while “Customer service” and “Customer support” may have subtle differences but should likely be combined into one code.
3. Capture the positive and the negative.
Try to create codes that contrast with each other to track both the positive and negative elements of a topic separately. For example, “Useful product features” and “Unnecessary product features” would be two different codes to capture two different themes.
4. Reduce data — to a point.
Let’s look at the two extremes: There are as many codes as there are responses, or each code applies to every single response. In both cases, the coding exercise is pointless; you don’t learn anything new about your data or your customers. To make your analysis as useful as possible, try to find a balance between having too many and too few codes.
Group responses based on themes, not words
Make sure to group responses with the same themes under the same code, even if they don’t use the same exact wording. For example, a code such as “cleanliness” could cover responses including words and phrases like:
- Looked like a dump
- Could eat off the floor
Having only a few codes and hierarchical framing makes it easier to group different words and phrases under one code. If you have too many codes, especially in a flat frame, your results can become ambiguous and themes can overlap. Manual coding also requires the coder to remember or be able to find all of the relevant codes; the more codes you have, the harder it is to find the ones you need, no matter how organized your codebook is.
Make accuracy a priority
Manually coding qualitative data means that the coder’s cognitive biases can influence the coding process. For each study, make sure you have coding guidelines and training in place to keep coding reliable, consistent, and accurate .
One thing to watch out for is definitional drift, which occurs when the data at the beginning of the data set is coded differently than the material coded later. Check for definitional drift across the entire dataset and keep notes with descriptions of how the codes vary across the results.
If you have multiple coders working on one team, have them check one another’s coding to help eliminate cognitive biases.
Conclusion: 6 main takeaways for coding qualitative data
Here are 6 final takeaways for manually coding your qualitative data:
- Coding is the process of labeling and organizing your qualitative data to identify themes. After you code your qualitative data, you can analyze it just like numerical data.
- Inductive coding (without a predefined code frame) is more difficult, but less prone to bias, than deductive coding.
- Code frames can be flat (easier and faster to use) or hierarchical (more powerful and organized).
- Your code frames need to be flexible enough that you can make the most of your results and use them in different contexts.
- When creating codes, make sure they cover several responses, contrast one another, and strike a balance between too much and too little information.
- Consistent coding = accuracy. Establish coding procedures and guidelines and keep an eye out for definitional drift in your qualitative data analysis.
Some more detail in our downloadable guide
If you’ve made it this far, you’ll likely be interested in our free guide: Best practices for analyzing open-ended questions.
The guide includes some of the topics covered in this article, and goes into some more niche details.
If your company is looking to automate your qualitative coding process, try Thematic !
If you're looking to trial multiple solutions, check out our free buyer's guide . It covers what to look for when trialing different feedback analytics solutions to ensure you get the depth of insights you need.
Happy coding!
Authored by Alyona Medelyan, PhD – Natural Language Processing & Machine Learning

CEO and Co-Founder
Alyona has a PhD in NLP and Machine Learning. Her peer-reviewed articles have been cited by over 2600 academics. Her love of writing comes from years of PhD research.
We make it easy to discover the customer and product issues that matter.
Unlock the value of feedback at scale, in one platform. Try it for free now!
- Questions to ask your Feedback Analytics vendor
- How to end customer churn for good
- Scalable analysis of NPS verbatims
- 5 Text analytics approaches
- How to calculate the ROI of CX
Our experts will show you how Thematic works, how to discover pain points and track the ROI of decisions. To access your free trial, book a personal demo today.
Recent posts
Watercare is New Zealand's largest water and wastewater service provider. They are responsible for bringing clean water to 1.7 million people in Tamaki Makaurau (Auckland) and safeguarding the wastewater network to minimize impact on the environment. Water is a sector that often gets taken for granted, with drainage and
Become a qualitative theming pro! Creating a perfect code frame is hard, but thematic analysis software makes the process much easier.
Qualtrics is one of the most well-known and powerful Customer Feedback Management platforms. But even so, it has limitations. We recently hosted a live panel where data analysts from two well-known brands shared their experiences with Qualtrics, and how they extended this platform’s capabilities. Below, we’ll share the
- Search Menu
- Browse content in Arts and Humanities
- Browse content in Archaeology
- Anglo-Saxon and Medieval Archaeology
- Archaeological Methodology and Techniques
- Archaeology by Region
- Archaeology of Religion
- Archaeology of Trade and Exchange
- Biblical Archaeology
- Contemporary and Public Archaeology
- Environmental Archaeology
- Historical Archaeology
- History and Theory of Archaeology
- Industrial Archaeology
- Landscape Archaeology
- Mortuary Archaeology
- Prehistoric Archaeology
- Underwater Archaeology
- Urban Archaeology
- Zooarchaeology
- Browse content in Architecture
- Architectural Structure and Design
- History of Architecture
- Residential and Domestic Buildings
- Theory of Architecture
- Browse content in Art
- Art Subjects and Themes
- History of Art
- Industrial and Commercial Art
- Theory of Art
- Biographical Studies
- Byzantine Studies
- Browse content in Classical Studies
- Classical History
- Classical Philosophy
- Classical Mythology
- Classical Literature
- Classical Reception
- Classical Art and Architecture
- Classical Oratory and Rhetoric
- Greek and Roman Epigraphy
- Greek and Roman Law
- Greek and Roman Papyrology
- Greek and Roman Archaeology
- Late Antiquity
- Religion in the Ancient World
- Digital Humanities
- Browse content in History
- Colonialism and Imperialism
- Diplomatic History
- Environmental History
- Genealogy, Heraldry, Names, and Honours
- Genocide and Ethnic Cleansing
- Historical Geography
- History by Period
- History of Emotions
- History of Agriculture
- History of Education
- History of Gender and Sexuality
- Industrial History
- Intellectual History
- International History
- Labour History
- Legal and Constitutional History
- Local and Family History
- Maritime History
- Military History
- National Liberation and Post-Colonialism
- Oral History
- Political History
- Public History
- Regional and National History
- Revolutions and Rebellions
- Slavery and Abolition of Slavery
- Social and Cultural History
- Theory, Methods, and Historiography
- Urban History
- World History
- Browse content in Language Teaching and Learning
- Language Learning (Specific Skills)
- Language Teaching Theory and Methods
- Browse content in Linguistics
- Applied Linguistics
- Cognitive Linguistics
- Computational Linguistics
- Forensic Linguistics
- Grammar, Syntax and Morphology
- Historical and Diachronic Linguistics
- History of English
- Language Acquisition
- Language Evolution
- Language Reference
- Language Variation
- Language Families
- Lexicography
- Linguistic Anthropology
- Linguistic Theories
- Linguistic Typology
- Phonetics and Phonology
- Psycholinguistics
- Sociolinguistics
- Translation and Interpretation
- Writing Systems
- Browse content in Literature
- Bibliography
- Children's Literature Studies
- Literary Studies (Asian)
- Literary Studies (European)
- Literary Studies (Eco-criticism)
- Literary Studies (Romanticism)
- Literary Studies (American)
- Literary Studies (Modernism)
- Literary Studies - World
- Literary Studies (1500 to 1800)
- Literary Studies (19th Century)
- Literary Studies (20th Century onwards)
- Literary Studies (African American Literature)
- Literary Studies (British and Irish)
- Literary Studies (Early and Medieval)
- Literary Studies (Fiction, Novelists, and Prose Writers)
- Literary Studies (Gender Studies)
- Literary Studies (Graphic Novels)
- Literary Studies (History of the Book)
- Literary Studies (Plays and Playwrights)
- Literary Studies (Poetry and Poets)
- Literary Studies (Postcolonial Literature)
- Literary Studies (Queer Studies)
- Literary Studies (Science Fiction)
- Literary Studies (Travel Literature)
- Literary Studies (War Literature)
- Literary Studies (Women's Writing)
- Literary Theory and Cultural Studies
- Mythology and Folklore
- Shakespeare Studies and Criticism
- Browse content in Media Studies
- Browse content in Music
- Applied Music
- Dance and Music
- Ethics in Music
- Ethnomusicology
- Gender and Sexuality in Music
- Medicine and Music
- Music Cultures
- Music and Religion
- Music and Media
- Music and Culture
- Music Education and Pedagogy
- Music Theory and Analysis
- Musical Scores, Lyrics, and Libretti
- Musical Structures, Styles, and Techniques
- Musicology and Music History
- Performance Practice and Studies
- Race and Ethnicity in Music
- Sound Studies
- Browse content in Performing Arts
- Browse content in Philosophy
- Aesthetics and Philosophy of Art
- Epistemology
- Feminist Philosophy
- History of Western Philosophy
- Metaphysics
- Moral Philosophy
- Non-Western Philosophy
- Philosophy of Science
- Philosophy of Language
- Philosophy of Mind
- Philosophy of Perception
- Philosophy of Action
- Philosophy of Law
- Philosophy of Religion
- Philosophy of Mathematics and Logic
- Practical Ethics
- Social and Political Philosophy
- Browse content in Religion
- Biblical Studies
- Christianity
- East Asian Religions
- History of Religion
- Judaism and Jewish Studies
- Qumran Studies
- Religion and Education
- Religion and Health
- Religion and Politics
- Religion and Science
- Religion and Law
- Religion and Art, Literature, and Music
- Religious Studies
- Browse content in Society and Culture
- Cookery, Food, and Drink
- Cultural Studies
- Customs and Traditions
- Ethical Issues and Debates
- Hobbies, Games, Arts and Crafts
- Lifestyle, Home, and Garden
- Natural world, Country Life, and Pets
- Popular Beliefs and Controversial Knowledge
- Sports and Outdoor Recreation
- Technology and Society
- Travel and Holiday
- Visual Culture
- Browse content in Law
- Arbitration
- Browse content in Company and Commercial Law
- Commercial Law
- Company Law
- Browse content in Comparative Law
- Systems of Law
- Competition Law
- Browse content in Constitutional and Administrative Law
- Government Powers
- Judicial Review
- Local Government Law
- Military and Defence Law
- Parliamentary and Legislative Practice
- Construction Law
- Contract Law
- Browse content in Criminal Law
- Criminal Procedure
- Criminal Evidence Law
- Sentencing and Punishment
- Employment and Labour Law
- Environment and Energy Law
- Browse content in Financial Law
- Banking Law
- Insolvency Law
- History of Law
- Human Rights and Immigration
- Intellectual Property Law
- Browse content in International Law
- Private International Law and Conflict of Laws
- Public International Law
- IT and Communications Law
- Jurisprudence and Philosophy of Law
- Law and Politics
- Law and Society
- Browse content in Legal System and Practice
- Courts and Procedure
- Legal Skills and Practice
- Primary Sources of Law
- Regulation of Legal Profession
- Medical and Healthcare Law
- Browse content in Policing
- Criminal Investigation and Detection
- Police and Security Services
- Police Procedure and Law
- Police Regional Planning
- Browse content in Property Law
- Personal Property Law
- Study and Revision
- Terrorism and National Security Law
- Browse content in Trusts Law
- Wills and Probate or Succession
- Browse content in Medicine and Health
- Browse content in Allied Health Professions
- Arts Therapies
- Clinical Science
- Dietetics and Nutrition
- Occupational Therapy
- Operating Department Practice
- Physiotherapy
- Radiography
- Speech and Language Therapy
- Browse content in Anaesthetics
- General Anaesthesia
- Neuroanaesthesia
- Browse content in Clinical Medicine
- Acute Medicine
- Cardiovascular Medicine
- Clinical Genetics
- Clinical Pharmacology and Therapeutics
- Dermatology
- Endocrinology and Diabetes
- Gastroenterology
- Genito-urinary Medicine
- Geriatric Medicine
- Infectious Diseases
- Medical Toxicology
- Medical Oncology
- Pain Medicine
- Palliative Medicine
- Rehabilitation Medicine
- Respiratory Medicine and Pulmonology
- Rheumatology
- Sleep Medicine
- Sports and Exercise Medicine
- Clinical Neuroscience
- Community Medical Services
- Critical Care
- Emergency Medicine
- Forensic Medicine
- Haematology
- History of Medicine
- Browse content in Medical Dentistry
- Oral and Maxillofacial Surgery
- Paediatric Dentistry
- Restorative Dentistry and Orthodontics
- Surgical Dentistry
- Browse content in Medical Skills
- Clinical Skills
- Communication Skills
- Nursing Skills
- Surgical Skills
- Medical Ethics
- Medical Statistics and Methodology
- Browse content in Neurology
- Clinical Neurophysiology
- Neuropathology
- Nursing Studies
- Browse content in Obstetrics and Gynaecology
- Gynaecology
- Occupational Medicine
- Ophthalmology
- Otolaryngology (ENT)
- Browse content in Paediatrics
- Neonatology
- Browse content in Pathology
- Chemical Pathology
- Clinical Cytogenetics and Molecular Genetics
- Histopathology
- Medical Microbiology and Virology
- Patient Education and Information
- Browse content in Pharmacology
- Psychopharmacology
- Browse content in Popular Health
- Caring for Others
- Complementary and Alternative Medicine
- Self-help and Personal Development
- Browse content in Preclinical Medicine
- Cell Biology
- Molecular Biology and Genetics
- Reproduction, Growth and Development
- Primary Care
- Professional Development in Medicine
- Browse content in Psychiatry
- Addiction Medicine
- Child and Adolescent Psychiatry
- Forensic Psychiatry
- Learning Disabilities
- Old Age Psychiatry
- Psychotherapy
- Browse content in Public Health and Epidemiology
- Epidemiology
- Public Health
- Browse content in Radiology
- Clinical Radiology
- Interventional Radiology
- Nuclear Medicine
- Radiation Oncology
- Reproductive Medicine
- Browse content in Surgery
- Cardiothoracic Surgery
- Gastro-intestinal and Colorectal Surgery
- General Surgery
- Neurosurgery
- Paediatric Surgery
- Peri-operative Care
- Plastic and Reconstructive Surgery
- Surgical Oncology
- Transplant Surgery
- Trauma and Orthopaedic Surgery
- Vascular Surgery
- Browse content in Science and Mathematics
- Browse content in Biological Sciences
- Aquatic Biology
- Biochemistry
- Bioinformatics and Computational Biology
- Developmental Biology
- Ecology and Conservation
- Evolutionary Biology
- Genetics and Genomics
- Microbiology
- Molecular and Cell Biology
- Natural History
- Plant Sciences and Forestry
- Research Methods in Life Sciences
- Structural Biology
- Systems Biology
- Zoology and Animal Sciences
- Browse content in Chemistry
- Analytical Chemistry
- Computational Chemistry
- Crystallography
- Environmental Chemistry
- Industrial Chemistry
- Inorganic Chemistry
- Materials Chemistry
- Medicinal Chemistry
- Mineralogy and Gems
- Organic Chemistry
- Physical Chemistry
- Polymer Chemistry
- Study and Communication Skills in Chemistry
- Theoretical Chemistry
- Browse content in Computer Science
- Artificial Intelligence
- Computer Architecture and Logic Design
- Game Studies
- Human-Computer Interaction
- Mathematical Theory of Computation
- Programming Languages
- Software Engineering
- Systems Analysis and Design
- Virtual Reality
- Browse content in Computing
- Business Applications
- Computer Security
- Computer Games
- Computer Networking and Communications
- Digital Lifestyle
- Graphical and Digital Media Applications
- Operating Systems
- Browse content in Earth Sciences and Geography
- Atmospheric Sciences
- Environmental Geography
- Geology and the Lithosphere
- Maps and Map-making
- Meteorology and Climatology
- Oceanography and Hydrology
- Palaeontology
- Physical Geography and Topography
- Regional Geography
- Soil Science
- Urban Geography
- Browse content in Engineering and Technology
- Agriculture and Farming
- Biological Engineering
- Civil Engineering, Surveying, and Building
- Electronics and Communications Engineering
- Energy Technology
- Engineering (General)
- Environmental Science, Engineering, and Technology
- History of Engineering and Technology
- Mechanical Engineering and Materials
- Technology of Industrial Chemistry
- Transport Technology and Trades
- Browse content in Environmental Science
- Applied Ecology (Environmental Science)
- Conservation of the Environment (Environmental Science)
- Environmental Sustainability
- Environmentalist Thought and Ideology (Environmental Science)
- Management of Land and Natural Resources (Environmental Science)
- Natural Disasters (Environmental Science)
- Nuclear Issues (Environmental Science)
- Pollution and Threats to the Environment (Environmental Science)
- Social Impact of Environmental Issues (Environmental Science)
- History of Science and Technology
- Browse content in Materials Science
- Ceramics and Glasses
- Composite Materials
- Metals, Alloying, and Corrosion
- Nanotechnology
- Browse content in Mathematics
- Applied Mathematics
- Biomathematics and Statistics
- History of Mathematics
- Mathematical Education
- Mathematical Finance
- Mathematical Analysis
- Numerical and Computational Mathematics
- Probability and Statistics
- Pure Mathematics
- Browse content in Neuroscience
- Cognition and Behavioural Neuroscience
- Development of the Nervous System
- Disorders of the Nervous System
- History of Neuroscience
- Invertebrate Neurobiology
- Molecular and Cellular Systems
- Neuroendocrinology and Autonomic Nervous System
- Neuroscientific Techniques
- Sensory and Motor Systems
- Browse content in Physics
- Astronomy and Astrophysics
- Atomic, Molecular, and Optical Physics
- Biological and Medical Physics
- Classical Mechanics
- Computational Physics
- Condensed Matter Physics
- Electromagnetism, Optics, and Acoustics
- History of Physics
- Mathematical and Statistical Physics
- Measurement Science
- Nuclear Physics
- Particles and Fields
- Plasma Physics
- Quantum Physics
- Relativity and Gravitation
- Semiconductor and Mesoscopic Physics
- Browse content in Psychology
- Affective Sciences
- Clinical Psychology
- Cognitive Psychology
- Cognitive Neuroscience
- Criminal and Forensic Psychology
- Developmental Psychology
- Educational Psychology
- Evolutionary Psychology
- Health Psychology
- History and Systems in Psychology
- Music Psychology
- Neuropsychology
- Organizational Psychology
- Psychological Assessment and Testing
- Psychology of Human-Technology Interaction
- Psychology Professional Development and Training
- Research Methods in Psychology
- Social Psychology
- Browse content in Social Sciences
- Browse content in Anthropology
- Anthropology of Religion
- Human Evolution
- Medical Anthropology
- Physical Anthropology
- Regional Anthropology
- Social and Cultural Anthropology
- Theory and Practice of Anthropology
- Browse content in Business and Management
- Business Strategy
- Business Ethics
- Business History
- Business and Government
- Business and Technology
- Business and the Environment
- Comparative Management
- Corporate Governance
- Corporate Social Responsibility
- Entrepreneurship
- Health Management
- Human Resource Management
- Industrial and Employment Relations
- Industry Studies
- Information and Communication Technologies
- International Business
- Knowledge Management
- Management and Management Techniques
- Operations Management
- Organizational Theory and Behaviour
- Pensions and Pension Management
- Public and Nonprofit Management
- Strategic Management
- Supply Chain Management
- Browse content in Criminology and Criminal Justice
- Criminal Justice
- Criminology
- Forms of Crime
- International and Comparative Criminology
- Youth Violence and Juvenile Justice
- Development Studies
- Browse content in Economics
- Agricultural, Environmental, and Natural Resource Economics
- Asian Economics
- Behavioural Finance
- Behavioural Economics and Neuroeconomics
- Econometrics and Mathematical Economics
- Economic Systems
- Economic History
- Economic Methodology
- Economic Development and Growth
- Financial Markets
- Financial Institutions and Services
- General Economics and Teaching
- Health, Education, and Welfare
- History of Economic Thought
- International Economics
- Labour and Demographic Economics
- Law and Economics
- Macroeconomics and Monetary Economics
- Microeconomics
- Public Economics
- Urban, Rural, and Regional Economics
- Welfare Economics
- Browse content in Education
- Adult Education and Continuous Learning
- Care and Counselling of Students
- Early Childhood and Elementary Education
- Educational Equipment and Technology
- Educational Strategies and Policy
- Higher and Further Education
- Organization and Management of Education
- Philosophy and Theory of Education
- Schools Studies
- Secondary Education
- Teaching of a Specific Subject
- Teaching of Specific Groups and Special Educational Needs
- Teaching Skills and Techniques
- Browse content in Environment
- Applied Ecology (Social Science)
- Climate Change
- Conservation of the Environment (Social Science)
- Environmentalist Thought and Ideology (Social Science)
- Natural Disasters (Environment)
- Social Impact of Environmental Issues (Social Science)
- Browse content in Human Geography
- Cultural Geography
- Economic Geography
- Political Geography
- Browse content in Interdisciplinary Studies
- Communication Studies
- Museums, Libraries, and Information Sciences
- Browse content in Politics
- African Politics
- Asian Politics
- Chinese Politics
- Comparative Politics
- Conflict Politics
- Elections and Electoral Studies
- Environmental Politics
- European Union
- Foreign Policy
- Gender and Politics
- Human Rights and Politics
- Indian Politics
- International Relations
- International Organization (Politics)
- International Political Economy
- Irish Politics
- Latin American Politics
- Middle Eastern Politics
- Political Methodology
- Political Communication
- Political Philosophy
- Political Sociology
- Political Behaviour
- Political Economy
- Political Institutions
- Political Theory
- Politics and Law
- Public Administration
- Public Policy
- Quantitative Political Methodology
- Regional Political Studies
- Russian Politics
- Security Studies
- State and Local Government
- UK Politics
- US Politics
- Browse content in Regional and Area Studies
- African Studies
- Asian Studies
- East Asian Studies
- Japanese Studies
- Latin American Studies
- Middle Eastern Studies
- Native American Studies
- Scottish Studies
- Browse content in Research and Information
- Research Methods
- Browse content in Social Work
- Addictions and Substance Misuse
- Adoption and Fostering
- Care of the Elderly
- Child and Adolescent Social Work
- Couple and Family Social Work
- Developmental and Physical Disabilities Social Work
- Direct Practice and Clinical Social Work
- Emergency Services
- Human Behaviour and the Social Environment
- International and Global Issues in Social Work
- Mental and Behavioural Health
- Social Justice and Human Rights
- Social Policy and Advocacy
- Social Work and Crime and Justice
- Social Work Macro Practice
- Social Work Practice Settings
- Social Work Research and Evidence-based Practice
- Welfare and Benefit Systems
- Browse content in Sociology
- Childhood Studies
- Community Development
- Comparative and Historical Sociology
- Economic Sociology
- Gender and Sexuality
- Gerontology and Ageing
- Health, Illness, and Medicine
- Marriage and the Family
- Migration Studies
- Occupations, Professions, and Work
- Organizations
- Population and Demography
- Race and Ethnicity
- Social Theory
- Social Movements and Social Change
- Social Research and Statistics
- Social Stratification, Inequality, and Mobility
- Sociology of Religion
- Sociology of Education
- Sport and Leisure
- Urban and Rural Studies
- Browse content in Warfare and Defence
- Defence Strategy, Planning, and Research
- Land Forces and Warfare
- Military Administration
- Military Life and Institutions
- Naval Forces and Warfare
- Other Warfare and Defence Issues
- Peace Studies and Conflict Resolution
- Weapons and Equipment

A newer edition of this book is available.
- < Previous chapter
- Next chapter >
28 Coding and Analysis Strategies
Johnny Saldaña, School of Theatre and Film, Arizona State University
- Published: 04 August 2014
- Cite Icon Cite
- Permissions Icon Permissions
This chapter provides an overview of selected qualitative data analytic strategies with a particular focus on codes and coding. Preparatory strategies for a qualitative research study and data management are first outlined. Six coding methods are then profiled using comparable interview data: process coding, in vivo coding, descriptive coding, values coding, dramaturgical coding, and versus coding. Strategies for constructing themes and assertions from the data follow. Analytic memo writing is woven throughout the preceding as a method for generating additional analytic insight. Next, display and arts-based strategies are provided, followed by recommended qualitative data analytic software programs and a discussion on verifying the researcher’s analytic findings.
Coding and Analysis Strategies
Anthropologist Clifford Geertz (1983) charmingly mused, “Life is just a bowl of strategies” (p. 25). Strategy , as I use it here, refers to a carefully considered plan or method to achieve a particular goal. The goal in this case is to develop a write-up of your analytic work with the qualitative data you have been given and collected as part of a study. The plans and methods you might employ to achieve that goal are what this article profiles.
Some may perceive strategy as an inappropriate if not colonizing word, suggesting formulaic or regimented approaches to inquiry. I assure you that that is not my intent. My use of strategy is actually dramaturgical in nature: strategies are actions that characters in plays take to overcome obstacles to achieve their objectives. Actors portraying these characters rely on action verbs to generate belief within themselves and to motivate them as they interpret the lines and move appropriately on stage. So what I offer is a qualitative researcher’s array of actions from which to draw to overcome the obstacles to thinking to achieve an analysis of your data. But unlike the pre-scripted text of a play in which the obstacles, strategies, and outcomes have been predetermined by the playwright, your work must be improvisational—acting, reacting, and interacting with data on a moment-by-moment basis to determine what obstacles stand in your way, and thus what strategies you should take to reach your goals.
Another intriguing quote to keep in mind comes from research methodologist Robert E. Stake (1995) who posits, “Good research is not about good methods as much as it is about good thinking” (p. 19). In other words, strategies can take you only so far. You can have a box full of tools, but if you do not know how to use them well or use them creatively, the collection seems rather purposeless. One of the best ways we learn is by doing . So pick up one or more of these strategies (in the form of verbs) and take analytic action with your data. Also keep in mind that these are discussed in the order in which they may typically occur, although humans think cyclically, iteratively, and reverberatively, and each particular research project has its own unique contexts and needs. So be prepared for your mind to jump purposefully and/or idiosyncratically from one strategy to another throughout the study.
QDA (Qualitative Data Analysis) Strategy: To Foresee
To foresee in QDA is to reflect beforehand on what forms of data you will most likely need and collect, which thus informs what types of data analytic strategies you anticipate using.
Analysis, in a way, begins even before you collect data. As you design your research study in your mind and on a word processor page, one strategy is to consider what types of data you may need to help inform and answer your central and related research questions. Interview transcripts, participant observation field notes, documents, artifacts, photographs, video recordings, and so on are not only forms of data but foundations for how you may plan to analyze them. A participant interview, for example, suggests that you will transcribe all or relevant portions of the recording, and use both the transcription and the recording itself as sources for data analysis. Any analytic memos (discussed later) or journal entries you make about your impressions of the interview also become data to analyze. Even the computing software you plan to employ will be relevant to data analysis as it may help or hinder your efforts.
As your research design formulates, compose one to two paragraphs that outline how your QDA may proceed. This will necessitate that you have some background knowledge of the vast array of methods available to you. Thus surveying the literature is vital preparatory work.
QDA Strategy: To Survey
To survey in QDA is to look for and consider the applicability of the QDA literature in your field that may provide useful guidance for your forthcoming data analytic work.
General sources in QDA will provide a good starting point for acquainting you with the data analytic strategies available for the variety of genres in qualitative inquiry (e.g., ethnography, phenomenology, case study, arts-based research, mixed methods). One of the most accessible is Graham R. Gibbs’ (2007) Analysing Qualitative Data , and one of the most richly detailed is Frederick J. Wertz et al.'s (2011) Five Ways of Doing Qualitative Analysis . The author’s core texts for this article came from The Coding Manual for Qualitative Researchers ( Saldaña, 2009 , 2013 ) and Fundamentals of Qualitative Research ( Saldaña, 2011 ).
If your study’s methodology or approach is grounded theory, for example, then a survey of methods works by such authors as Barney G. Glaser, Anselm L. Strauss, Juliet Corbin and, in particular, the prolific Kathy Charmaz (2006) may be expected. But there has been a recent outpouring of additional book publications in grounded theory by Birks & Mills (2011) , Bryant & Charmaz (2007) , Stern & Porr (2011) , plus the legacy of thousands of articles and chapters across many disciplines that have addressed grounded theory in their studies.
Particular fields such as education, psychology, social work, health care, and others also have their own QDA methods literature in the form of texts and journals, plus international conferences and workshops for members of the profession. Most important is to have had some university coursework and/or mentorship in qualitative research to suitably prepare you for the intricacies of QDA. Also acknowledge that the emergent nature of qualitative inquiry may require you to adopt different analytic strategies from what you originally planned.
QDA Strategy: To Collect
To collect in QDA is to receive the data given to you by participants and those data you actively gather to inform your study.
QDA is concurrent with data collection and management. As interviews are transcribed, field notes are fleshed out, and documents are filed, the researcher uses the opportunity to carefully read the corpus and make preliminary notations directly on the data documents by highlighting, bolding, italicizing, or noting in some way any particularly interesting or salient portions. As these data are initially reviewed, the researcher also composes supplemental analytic memos that include first impressions, reminders for follow-up, preliminary connections, and other thinking matters about the phenomena at work.
Some of the most common fieldwork tools you might use to collect data are notepads, pens and pencils, file folders for documents, a laptop or desktop with word processing software (Microsoft Word and Excel are most useful) and internet access, a digital camera, and a voice recorder. Some fieldworkers may even employ a digital video camera to record social action, as long as participant permissions have been secured. But everything originates from the researcher himself or herself. Your senses are immersed in the cultural milieu you study, taking in and holding on to relevant details or “significant trivia,” as I call them. You become a human camera, zooming out to capture the broad landscape of your field site one day, then zooming in on a particularly interesting individual or phenomenon the next. Your analysis is only as good as the data you collect.
Fieldwork can be an overwhelming experience because so many details of social life are happening in front of you. Take a holistic approach to your entree, but as you become more familiar with the setting and participants, actively focus on things that relate to your research topic and questions. Of course, keep yourself open to the intriguing, surprising, and disturbing ( Sunstein & Chiseri-Strater, 2012 , p. 115), for these facets enrich your study by making you aware of the unexpected.
QDA Strategy: To Feel
To feel in QDA is to gain deep emotional insight into the social worlds you study and what it means to be human.
Virtually everything we do has an accompanying emotion(s), and feelings are both reactions and stimuli for action. Others’ emotions clue you to their motives, attitudes, values, beliefs, worldviews, identities, and other subjective perceptions and interpretations. Acknowledge that emotional detachment is not possible in field research. Attunement to the emotional experiences of your participants plus sympathetic and empathetic responses to the actions around you are necessary in qualitative endeavors. Your own emotional responses during fieldwork are also data because they document the tacit and visceral. It is important during such analytic reflection to assess why your emotional reactions were as they were. But it is equally important not to let emotions alone steer the course of your study. A proper balance must be found between feelings and facts.
QDA Strategy: To Organize
To organize in QDA is to maintain an orderly repository of data for easy access and analysis.
Even in the smallest of qualitative studies, a large amount of data will be collected across time. Prepare both a hard drive and hard copy folders for digital data and paperwork, and back up all materials for security from loss. I recommend that each data “chunk” (e.g., one interview transcript, one document, one day’s worth of field notes) get its own file, with subfolders specifying the data forms and research study logistics (e.g., interviews, field notes, documents, Institutional Review Board correspondence, calendar).
For small-scale qualitative studies, I have found it quite useful to maintain one large master file with all participant and field site data copied and combined with the literature review and accompanying researcher analytic memos. This master file is used to cut and paste related passages together, deleting what seems unnecessary as the study proceeds, and eventually transforming the document into the final report itself. Cosmetic devices such as font style, font size, rich text (italicizing, bolding, underlining, etc.), and color can help you distinguish between different data forms and highlight significant passages. For example, descriptive, narrative passages of field notes are logged in regular font. “Quotations, things spoken by participants, are logged in bold font.” Observer’s comments, such as the researcher’s subjective impressions or analytic jottings, are set in italics.
QDA Strategy: To Jot
To jot in QDA is to write occasional, brief notes about your thinking or reminders for follow up.
A jot is a phrase or brief sentence that will literally fit on a standard size “sticky note.” As data are brought and documented together, take some initial time to review their contents and to jot some notes about preliminary patterns, participant quotes that seem quite vivid, anomalies in the data, and so forth.
As you work on a project, keep something to write with or to voice record with you at all times to capture your fleeting thoughts. You will most likely find yourself thinking about your research when you're not working exclusively on the project, and a “mental jot” may occur to you as you ruminate on logistical or analytic matters. Get the thought documented in some way for later retrieval and elaboration as an analytic memo.
QDA Strategy: To Prioritize
To prioritize in QDA is to determine which data are most significant in your corpus and which tasks are most necessary.
During fieldwork, massive amounts of data in various forms may be collected, and your mind can get easily overwhelmed from the magnitude of the quantity, its richness, and its management. Decisions will need to be made about the most pertinent of them because they help answer your research questions or emerge as salient pieces of evidence. As a sweeping generalization, approximately one half to two thirds of what you collect may become unnecessary as you proceed toward the more formal stages of QDA.
To prioritize in QDA is to also determine what matters most in your assembly of codes, categories, themes, assertions, and concepts. Return back to your research purpose and questions to keep you framed for what the focus should be.
QDA Strategy: To Analyze
To analyze in QDA is to observe and discern patterns within data and to construct meanings that seem to capture their essences and essentials.
Just as there are a variety of genres, elements, and styles of qualitative research, so too are there a variety of methods available for QDA. Analytic choices are most often based on what methods will harmonize with your genre selection and conceptual framework, what will generate the most sufficient answers to your research questions, and what will best represent and present the project’s findings.
Analysis can range from the factual to the conceptual to the interpretive. Analysis can also range from a straightforward descriptive account to an emergently constructed grounded theory to an evocatively composed short story. A qualitative research project’s outcomes may range from rigorously achieved, insightful answers to open-ended, evocative questions; from rich descriptive detail to a bullet-pointed list of themes; and from third-person, objective reportage to first-person, emotion-laden poetry. Just as there are multiple destinations in qualitative research, there are multiple pathways and journeys along the way.
Analysis is accelerated as you take cognitive ownership of your data. By reading and rereading the corpus, you gain intimate familiarity with its contents and begin to notice significant details as well as make new insights about their meanings. Patterns, categories, and their interrelationships become more evident the more you know the subtleties of the database.
Since qualitative research’s design, fieldwork, and data collection are most often provisional, emergent, and evolutionary processes, you reflect on and analyze the data as you gather them and proceed through the project. If preplanned methods are not working, you change them to secure the data you need. There is generally a post-fieldwork period when continued reflection and more systematic data analysis occur, concurrent with or followed by additional data collection, if needed, and the more formal write-up of the study, which is in itself an analytic act. Through field note writing, interview transcribing, analytic memo writing, and other documentation processes, you gain cognitive ownership of your data; and the intuitive, tacit, synthesizing capabilities of your brain begin sensing patterns, making connections, and seeing the bigger picture. The purpose and outcome of data analysis is to reveal to others through fresh insights what we have observed and discovered about the human condition. And fortunately, there are heuristics for reorganizing and reflecting on your qualitative data to help you achieve that goal.
QDA Strategy: To Pattern
To pattern in QDA is to detect similarities within and regularities among the data you have collected.
The natural world is filled with patterns because we, as humans, have constructed them as such. Stars in the night sky are not just a random assembly; our ancestors pieced them together to form constellations like the Big Dipper. A collection of flowers growing wild in a field has a pattern, as does an individual flower’s patterns of leaves and petals. Look at the physical objects humans have created and notice how pattern oriented we are in our construction, organization, and decoration. Look around you in your environment and notice how many patterns are evident on your clothing, in a room, and on most objects themselves. Even our sometimes mundane daily and long-term human actions are reproduced patterns in the form of roles, relationships, rules, routines, and rituals.
This human propensity for pattern making follows us into QDA. From the vast array of interview transcripts, field notes, documents, and other forms of data, there is this instinctive, hardwired need to bring order to the collection—not just to reorganize it but to look for and construct patterns out of it. The discernment of patterns is one of the first steps in the data analytic process, and the methods described next are recommended ways to construct them.
QDA Strategy: To Code
To code in QDA is to assign a truncated, symbolic meaning to each datum for purposes of qualitative analysis.
Coding is a heuristic—a method of discovery—to the meanings of individual sections of data. These codes function as a way of patterning, classifying, and later reorganizing them into emergent categories for further analysis. Different types of codes exist for different types of research genres and qualitative data analytic approaches, but this article will focus on only a few selected methods. First, a definition of a code:
A code in qualitative data analysis is most often a word or short phrase that symbolically assigns a summative, salient, essence-capturing, and/or evocative attribute for a portion of language-based or visual data. The data can consist of interview transcripts, participant observation fieldnotes, journals, documents, literature, artifacts, photographs, video, websites, e-mail correspondence, and so on. The portion of data to be coded can... range in magnitude from a single word to a full sentence to an entire page of text to a stream of moving images.... Just as a title represents and captures a book or film or poem’s primary content and essence, so does a code represent and capture a datum’s primary content and essence. [ Saldaña, 2009 , p. 3]
One helpful pre-coding task is to divide long selections of field note or interview transcript data into shorter stanzas . Stanza division “chunks” the corpus into more manageable paragraph-like units for coding assignments and analysis. The transcript sample that follows illustrates one possible way of inserting line breaks in-between self-standing passages of interview text for easier readability.
Process Coding
As a first coding example, the following interview excerpt about an employed, single, lower-middle-class adult male’s spending habits during the difficult economic times in the U.S. during 2008–2012 is coded in the right-hand margin in capital letters. The superscript numbers match the datum unit with its corresponding code. This particular method is called process coding, which uses gerunds (“-ing” words) exclusively to represent action suggested by the data. Processes can consist of observable human actions (e.g., BUYING BARGAINS), mental processes (e.g., THINKING TWICE), and more conceptual ideas (e.g., APPRECIATING WHAT YOU’VE GOT). Notice that the interviewer’s (I) portions are not coded, just the participant’s (P). A code is applied each time the subtopic of the interview shifts—even within a stanza—and the same codes can (and should) be used more than once if the subtopics are similar. The central research question driving this qualitative study is, “In what ways are middle-class Americans influenced and affected by the current [2008–2012] economic recession?”
Different researchers analyzing this same piece of data may develop completely different codes, depending on their lenses and filters. The previous codes are only one person’s interpretation of what is happening in the data, not the definitive list. The process codes have transformed the raw data units into new representations for analysis. A listing of them applied to this interview transcript, in the order they appear, reads:
BUYING BARGAINS
QUESTIONING A PURCHASE
THINKING TWICE
STOCKING UP
REFUSING SACRIFICE
PRIORITIZING
FINDING ALTERNATIVES
LIVING CHEAPLY
NOTICING CHANGES
STAYING INFORMED
MAINTAINING HEALTH
PICKING UP THE TAB
APPRECIATING WHAT YOU’VE GOT
Coding the data is the first step in this particular approach to QDA, and categorization is just one of the next possible steps.
QDA Strategy: To Categorize
To categorize in QDA is to cluster similar or comparable codes into groups for pattern construction and further analysis.
Humans categorize things in innumerable ways. Think of an average apartment or house’s layout. The rooms of a dwelling have been constructed or categorized by their builders and occupants according to function. A kitchen is designated as an area to store and prepare food and the cooking and dining materials such as pots, pans, and utensils. A bedroom is designated for sleeping, a closet for clothing storage, a bathroom for bodily functions and hygiene, and so on. Each room is like a category in which related and relevant patterns of human action occur. Of course, there are exceptions now and then, such as eating breakfast in bed rather than in a dining area or living in a small studio apartment in which most possessions are contained within one large room (but nonetheless are most often organized and clustered into subcategories according to function and optimal use of space).
The point here is that the patterns of social action we designate into particular categories during QDA are not perfectly bounded. Category construction is our best attempt to cluster the most seemingly alike things into the most seemingly appropriate groups. Categorizing is reorganizing and reordering the vast array of data from a study because it is from these smaller, larger, and meaning-rich units that we can better grasp the particular features of each one and the categories’ possible interrelationships with one another.
One analytic strategy with a list of codes is to classify them into similar clusters. Obviously, the same codes share the same category, but it is also possible that a single code can merit its own group if you feel it is unique enough. After the codes have been classified, a category label is applied to each grouping. Sometimes a code can also double as a category name if you feel it best summarizes the totality of the cluster. Like coding, categorizing is an interpretive act, for there can be different ways of separating and collecting codes that seem to belong together. The cut-and-paste functions of a word processor are most useful for exploring which codes share something in common.
Below is my categorization of the fifteen codes generated from the interview transcript presented earlier. Like the gerunds for process codes, the categories have also been labeled as “-ing” words to connote action. And there was no particular reason why fifteen codes resulted in three categories—there could have been less or even more, but this is how the array came together after my reflections on which codes seemed to belong together. The category labels are ways of answering “why” they belong together. For at-a-glance differentiation, I place codes in CAPITAL LETTERS and categories in upper and lower case Bold Font :
Category 1: Thinking Strategically
Category 2: Spending Strategically
Category 3: Living Strategically
APPRECIATING WHAT YOU'VE GOT
Notice that the three category labels share a common word: “strategically.” Where did this word come from? It came from analytic reflection on the original data, the codes, and the process of categorizing the codes and generating their category labels. It was the analyst’s choice based on the interpretation of what primary action was happening. Your categories generated from your coded data do not need to share a common word or phrase, but I find that this technique, when appropriate, helps build a sense of unity to the initial analytic scheme.
The three categories— Thinking Strategically , Spending Strategically , and Living Strategically —are then reflected upon for how they might interact and interplay. This is where the next major facet of data analysis, analytic memos, enters the scheme. But a necessary section on the basic principles of interrelationship and analytic reasoning must precede that discussion.
QDA Strategy: To Interrelate
To interrelate in QDA is to propose connections within, between, and among the constituent elements of analyzed data.
One task of QDA is to explore the ways our patterns and categories interact and interplay. I use these terms to suggest the qualitative equivalent of statistical correlation, but interaction and interplay are much more than a simple relationship. They imply interrelationship . Interaction refers to reverberative connections—for example, how one or more categories might influence and affect the others, how categories operate concurrently, or whether there is some kind of “domino” effect to them. Interplay refers to the structural and processual nature of categories—for example, whether some type of sequential order, hierarchy, or taxonomy exists; whether any overlaps occur; whether there is superordinate and subordinate arrangement; and what types of organizational frameworks or networks might exist among them. The positivist construct of “cause and effect” becomes influences and affects in QDA.
There can even be patterns of patterns and categories of categories if your mind thinks conceptually and abstractly enough. Our minds can intricately connect multiple phenomena but only if the data and their analyses support the constructions. We can speculate about interaction and interplay all we want, but it is only through a more systematic investigation of the data—in other words, good thinking—that we can plausibly establish any possible interrelationships.
QDA Strategy: To Reason
To reason in QDA is to think in ways that lead to causal probabilities, summative findings, and evaluative conclusions.
Unlike quantitative research, with its statistical formulas and established hypothesis-testing protocols, qualitative research has no standardized methods of data analysis. Rest assured, there are recommended guidelines from the field’s scholars and a legacy of analytic strategies from which to draw. But the primary heuristics (or methods of discovery) you apply during a study are deductive , inductive , abductive , and retroductive reasoning. Deduction is what we generally draw and conclude from established facts and evidence. Induction is what we experientially explore and infer to be transferable from the particular to the general, based on an examination of the evidence and an accumulation of knowledge. Abduction is surmising from the evidence that which is most likely, those explanatory hunches based on clues. “Whereas deductive inferences are certain (so long as their premises are true) and inductive inferences are probable, abductive inferences are merely plausible” ( Shank, 2008 , p. 1). Retroduction is historic reconstruction, working backwards to figure out how the current conditions came to exist.
It is not always necessary to know the names of these four ways of reasoning as you proceed through analysis. In fact, you will more than likely reverberate quickly from one to another depending on the task at hand. But what is important to remember about reasoning is:
to base your conclusions primarily on the participants’ experiences, not just your own
not to take the obvious for granted, as sometimes the expected won't always happen. Your hunches can be quite right and, at other times, quite wrong
to examine the evidence carefully and make reasonable inferences
to logically yet imaginatively think about what is going on and how it all comes together.
Futurists and inventors propose three questions when they think about creating new visions for the world: What is possible (induction)? What is plausible (abduction)? What is preferable (deduction)? These same three questions might be posed as you proceed through QDA and particularly through analytic memo writing, which is retroductive reflection on your analytic work thus far.
QDA Strategy: To Memo
To memo in QDA is to reflect in writing on the nuances, inferences, meanings, and transfer of coded and categorized data plus your analytic processes.
Like field note writing, perspectives vary among practitioners as to the methods for documenting the researcher’s analytic insights and subjective experiences. Some advise that such reflections should be included in field notes as relevant to the data. Others advise that a separate researcher’s journal should be maintained for recording these impressions. And still others advise that these thoughts be documented as separate analytic memos. I prescribe the latter as a method because it is generated by and directly connected to the data themselves.
An analytic memo is a “think piece” of reflexive free writing, a narrative that sets in words your interpretations of the data. Coding and categorizing are heuristics to detect some of the possible patterns and interrelationships at work within the corpus, and an analytic memo further articulates your deductive, inductive, abductive, and retroductive thinking processes on what things may mean. Though the metaphor is a bit flawed and limiting, think of codes and their consequent categories as separate jigsaw puzzle pieces, and their integration into an analytic memo as the trial assembly of the complete picture.
What follows is an example of an analytic memo based on the earlier process coded and categorized interview transcript. It is not intended as the final write-up for a publication but as an open-ended reflection on the phenomena and processes suggested by the data and their analysis thus far. As the study proceeds, however, initial and substantive analytic memos can be revisited and revised for eventual integration into the final report. Note how the memo is dated and given a title for future and further categorization, how participant quotes are occasionally included for evidentiary support, and how the category names are bolded and the codes kept in capital letters to show how they integrate or weave into the thinking:
March 18, 2012 EMERGENT CATEGORIES: A STRATEGIC AMALGAM There’s a popular saying now: “Smart is the new rich.” This participant is Thinking Strategically about his spending through such tactics as THINKING TWICE and QUESTIONING A PURCHASE before he decides to invest in a product. There’s a heightened awareness of both immediate trends and forthcoming economic bad news that positively affects his Spending Strategically . However, he seems unaware that there are even more ways of LIVING CHEAPLY by FINDING ALTERNATIVES. He dines at all-you-can-eat restaurants as a way of STOCKING UP on meals, but doesn’t state that he could bring lunch from home to work, possibly saving even more money. One of his “bad habits” is cigarettes, which he refuses to give up; but he doesn’t seem to realize that by quitting smoking he could save even more money, not to mention possible health care costs. He balks at the idea of paying $1.50 for a soft drink, but doesn’t mind paying $6.00–$7.00 for a pack of cigarettes. Penny-wise and pound-foolish. Addictions skew priorities. Living Strategically , for this participant during “scary times,” appears to be a combination of PRIORITIZING those things which cannot be helped, such as pet care and personal dental care; REFUSING SACRIFICE for maintaining personal creature-comforts; and FINDING ALTERNATIVES to high costs and excessive spending. Living Strategically is an amalgam of thinking and action-oriented strategies.
There are several recommended topics for analytic memo writing throughout the qualitative study. Memos are opportunities to reflect on and write about:
how you personally relate to the participants and/or the phenomenon
your study’s research questions
your code choices and their operational definitions
the emergent patterns, categories, themes, assertions, and concepts
the possible networks (links, connections, overlaps, flows) among the codes, patterns, categories, themes, assertions, and concepts
an emergent or related existent theory
any problems with the study
any personal or ethical dilemmas with the study
future directions for the study
the analytic memos generated thus far [labeled “metamemos”]
the final report for the study [adapted from Saldaña, 2013 , p. 49]
Since writing is analysis, analytic memos expand on the inferential meanings of the truncated codes and categories as a transitional stage into a more coherent narrative with hopefully rich social insight.
QDA Strategy: To Code—A Different Way
The first example of coding illustrated process coding, a way of exploring general social action among humans. But sometimes a researcher works with an individual case study whose language is unique, or with someone the researcher wishes to honor by maintaining the authenticity of his or her speech in the analysis. These reasons suggest that a more participant-centered form of coding may be more appropriate.
In Vivo Coding
A second frequently applied method of coding is called in vivo coding. The root meaning of “in vivo” is “in that which is alive” and refers to a code based on the actual language used by the participant ( Strauss, 1987 ). What words or phrases in the data record you select as codes are those that seem to stand out as significant or summative of what is being said.
Using the same transcript of the male participant living in difficult economic times, in vivo codes are listed in the right-hand column. I recommend that in vivo codes be placed in quotation marks as a way of designating that the code is extracted directly from the data record. Note that instead of fifteen codes generated from process coding, the total number of in vivo codes is thirty. This is not to suggest that there should be specific numbers or ranges of codes used for particular methods. In vivo codes, though, tend to be applied more frequently to data. Again, the interviewer’s questions and prompts are not coded, just the participant's responses:
The thirty in vivo codes are then extracted from the transcript and listed in the order they appear to prepare them for analytic action and reflection:
“SKYROCKETED”
“TWO-FOR-ONE”
“THE LITTLE THINGS”
“THINK TWICE”
“ALL-YOU-CAN-EAT”
“CHEAP AND FILLING”
“BAD HABITS”
“DON'T REALLY NEED”
“LIVED KIND OF CHEAP”
“NOT A BIG SPENDER”
“HAVEN'T CHANGED MY HABITS”
“NOT PUTTING AS MUCH INTO SAVINGS”
“SPENDING MORE”
“ANOTHER DING IN MY WALLET”
“HIGH MAINTENANCE”
“COUPLE OF THOUSAND”
“INSURANCE IS JUST WORTHLESS”
“PICK UP THE TAB”
“IT ALL ADDS UP”
“NOT AS BAD OFF”
“SCARY TIMES”
Even though no systematic reorganization or categorization has been conducted with the codes thus far, an analytic memo of first impressions can still be composed:
March 19, 2012 CODE CHOICES: THE EVERYDAY LANGUAGE OF ECONOMICS After eyeballing the in vivo codes list, I noticed that variants of “CHEAP” appear most often. I recall a running joke between me and a friend of mine when we were shopping for sales. We’d say, “We're not ‘cheap,’ we're frugal .” There’s no formal economic or business language is this transcript—no terms such as “recession” or “downsizing”—just the everyday language of one person trying to cope during “SCARY TIMES” with “ANOTHER DING IN MY WALLET.” The participant notes that he’s always “LIVED KIND OF CHEAP” and is “NOT A BIG SPENDER” and, due to his employment, “NOT AS BAD OFF” as others in the country. Yet even with his middle class status, he’s still feeling the monetary pinch, dining at inexpensive “ALL-YOU-CAN-EAT” restaurants and worried about the rising price of peanut butter, observing that he’s “NOT PUTTING AS MUCH INTO SAVINGS” as he used to. Of all the codes, “ANOTHER DING IN MY WALLET” stands out to me, particularly because on the audio recording he sounded bitter and frustrated. It seems that he’s so concerned about “THE LITTLE THINGS” because of high veterinary and dental charges. The only way to cope with a “COUPLE OF THOUSAND” dollars worth of medical expenses is to find ways of trimming the excess in everyday facets of living: “IT ALL ADDS UP.”
Like process coding, in vivo codes could be clustered into similar categories, but another simple data analytic strategy is also possible.
QDA Strategy: To Outline
To outline in QDA is to hierarchically, processually, and/or temporally assemble such things as codes, categories, themes, assertions, and concepts into a coherent, text-based display.
Traditional outlining formats and content provide not only templates for writing a report but templates for analytic organization. This principle can be found in several CAQDAS (Computer Assisted Qualitative Data Analysis Software) programs through their use of such functions as “hierarchies,” “trees,” and “nodes,” for example. Basic outlining is simply a way of arranging primary, secondary, and sub-secondary items into a patterned display. For example, an organized listing of things in a home might consist of:
Large appliances
Refrigerator
Stove-top oven
Microwave oven
Small appliances
Coffee maker
Dining room
In QDA, outlining may include descriptive nouns or topics but, depending on the study, it may also involve processes or phenomena in extended passages, such as in vivo codes or themes.
The complexity of what we learn in the field can be overwhelming, and outlining is a way of organizing and ordering that complexity so that it does not become complicated. The cut-and-paste and tab functions of a word processor page enable you to arrange and rearrange the salient items from your preliminary coded analytic work into a more streamlined flow. By no means do I suggest that the intricate messiness of life can always be organized into neatly formatted arrangements, but outlining is an analytic act that stimulates deep reflection on both the interconnectedness and interrelationships of what we study. As an example, here are the thirty in vivo codes generated from the initial transcript analysis, arranged in such a way as to construct five major categories:
“DON’T REALLY NEED”
“HAVEN’T CHANGED MY HABITS”
Now that the codes have been rearranged into an outline format, an analytic memo is composed to expand on the rationale and constructed meanings in progress:
March 19, 2012 NETWORKS: EMERGENT CATEGORIES The five major categories I constructed from the in vivo codes are: “SCARY TIMES,” “PRIORTY,” “ANOTHER DING IN MY WALLET,” “THE LITTLE THINGS,” and “LIVED KIND OF CHEAP.” One of the things that hit me today was that the reason he may be pinching pennies on smaller purchases is that he cannot control the larger ones he has to deal with. Perhaps the only way we can cope with or seem to have some sense of agency over major expenses is to cut back on the smaller ones that we can control. $1,000 for a dental bill? Skip lunch for a few days a week. Insulin medication to buy for a pet? Don’t buy a soft drink from a vending machine. Using this reasoning, let me try to interrelate and weave the categories together as they relate to this particular participant: During these scary economic times, he prioritizes his spending because there seems to be just one ding after another to his wallet. A general lifestyle of living cheaply and keeping an eye out for how to save money on the little things compensates for those major expenses beyond his control.
QDA Strategy: To Code—In Even More Ways
The process and in vivo coding examples thus far have demonstrated only two specific methods of thirty-two documented approaches ( Saldaña, 2013 ). Which one(s) you choose for your analysis depends on such factors as your conceptual framework, the genre of qualitative research for your project, the types of data you collect, and so on. The following sections present a few other approaches available for coding qualitative data that you may find useful as starting points.
Descriptive Coding
Descriptive codes are primarily nouns that simply summarize the topic of a datum. This coding approach is particularly useful when you have different types of data gathered for one study, such as interview transcripts, field notes, documents, and visual materials such as photographs. Descriptive codes not only help categorize but also index the data corpus’ basic contents for further analytic work. An example of an interview portion coded descriptively, taken from the participant living in tough economic times, follows to illustrate how the same data can be coded in multiple ways:
For initial analysis, descriptive codes are clustered into similar categories to detect such patterns as frequency (i.e., categories with the largest number of codes), interrelationship (i.e., categories that seem to connect in some way), and initial work for grounded theory development.
Values Coding
Values coding identifies the values, attitudes, and beliefs of a participant, as shared by the individual and/or interpreted by the analyst. This coding method infers the “heart and mind” of an individual or group’s worldview as to what is important, perceived as true, maintained as opinion, and felt strongly. The three constructs are coded separately but are part of a complex interconnected system.
Briefly, a value (V) is what we attribute as important, be it a person, thing, or idea. An attitude (A) is the evaluative way we think and feel about ourselves, others, things, or ideas. A belief (B) is what we think and feel as true or necessary, formed from our “personal knowledge, experiences, opinions, prejudices, morals, and other interpretive perceptions of the social world” ( Saldaña, 2009 , pp. 89–90). Values coding explores intrapersonal, interpersonal, and cultural constructs or ethos . It is an admittedly slippery task to code this way, for it is sometimes difficult to discern what is a value, attitude, or belief because they are intricately interrelated. But the depth you can potentially obtain is rich. An example of values coding follows:
For analysis, categorize the codes for each of the three different constructs together (i.e., all values in one group, attitudes in a second group, and beliefs in a third group). Analytic memo writing about the patterns and possible interrelationships may reveal a more detailed and intricate worldview of the participant.
Dramaturgical Coding
Dramaturgical coding perceives life as performance and its participants as characters in a social drama. Codes are assigned to the data (i.e., a “play script”) that analyze the characters in action, reaction, and interaction. Dramaturgical coding of participants examines their objectives (OBJ) or wants, needs, and motives; the conflicts (CON) or obstacles they face as they try to achieve their objectives; the tactics (TAC) or strategies they employ to reach their objectives; their attitudes (ATT) toward others and their given circumstances; the particular emotions (EMO) they experience throughout; and their subtexts (SUB) or underlying and unspoken thoughts. The following is an example of dramaturgically coded data:
Not included in this particular interview excerpt are the emotions the participant may have experienced or talked about. His later line, “that’s another ding in my wallet,” would have been coded EMO: BITTER. A reader may not have inferred that specific emotion from seeing the line in print. But the interviewer, present during the event and listening carefully to the audio recording during transcription, noted that feeling in his tone of voice.
For analysis, group similar codes together (e.g., all objectives in one group, all conflicts in another group, all tactics in a third group), or string together chains of how participants deal with their circumstances to overcome their obstacles through tactics (e.g., OBJ: SAVING MEAL MONEY > TAC: SKIPPING MEALS). Explore how the individuals or groups manage problem solving in their daily lives. Dramaturgical coding is particularly useful as preliminary work for narrative inquiry story development or arts-based research representations such as performance ethnography.
Versus Coding
Versus coding identifies the conflicts, struggles, and power issues observed in social action, reaction, and interaction as an X VS. Y code, such as: MEN VS. WOMEN, CONSERVATIVES VS. LIBERALS, FAITH VS. LOGIC, and so on. Conflicts are rarely this dichotomous. They are typically nuanced and much more complex. But humans tend to perceive these struggles with an US VS. THEM mindset. The codes can range from the observable to the conceptual and can be applied to data that show humans in tension with others, themselves, or ideologies.
What follows are examples of versus codes applied to the case study participant’s descriptions of his major medical expenses:
As an initial analytic tactic, group the versus codes into one of three categories: the Stakeholders , their Perceptions and/or Actions , and the Issues at stake. Examine how the three interrelate and identify the central ideological conflict at work as an X vs. Y category. Analytic memos and the final write-up can detail the nuances of the issues.
Remember that what has been profiled in this section is a broad brushstroke description of just a few basic coding processes, several of which can be compatibly “mixed and matched” within a single analysis (see Saldaña’s [2013] The Coding Manual for Qualitative Researchers for a complete discussion). Certainly with additional data, more in-depth analysis can occur, but coding is only one approach to extracting and constructing preliminary meanings from the data corpus. What now follows are additional methods for qualitative analysis.
QDA Strategy: To Theme
To theme in QDA is to construct summative, phenomenological meanings from data through extended passages of text.
Unlike codes, which are most often single words or short phrases that symbolically represent a datum, themes are extended phrases or sentences that summarize the manifest (apparent) and latent (underlying) meanings of data ( Auerbach & Silverstein, 2003 ; Boyatzis, 1998 ). Themes, intended to represent the essences and essentials of humans’ lived experiences, can also be categorized or listed in superordinate and subordinate outline formats as an analytic tactic.
Below is the interview transcript example used in the coding sections above. (Hopefully you are not too fatigued at this point with the transcript, but it’s important to know how inquiry with the same data set can be approached in several different ways.) During the investigation of the ways middle-class Americans are influenced and affected by the current (2008–2012) economic recession, the researcher noticed that participants’ stories exhibited facets of what he labeled “economic intelligence” or EI (based on the formerly developed theories of Howard Gardner’s multiple intelligences and Daniel Goleman’s emotional intelligence). Notice how themeing interprets what is happening through the use of two distinct phrases—ECONOMIC INTELLIGENCE IS (i.e., manifest or apparent meanings) and ECONOMIC INTELLIGENCE MEANS (i.e., latent or underlying meanings):
Unlike the fifteen process codes and thirty in vivo codes in the previous examples, there are now fourteen themes to work with. In the order they appear, they are:
EI IS TAKING ADVANTAGE OF UNEXPECTED OPPORTUNITY
EI MEANS THINKING BEFORE YOU ACT
EI IS BUYING CHEAP
EI MEANS SACRIFICE
EI IS SAVING A FEW DOLLARS NOW AND THEN
EI MEANS KNOWING YOUR FLAWS
EI IS SETTING PRIORITIES
EI IS FINDING CHEAPER FORMS OF ENTERTAINMENT
EI MEANS LIVING AN INEXPENSIVE LIFESTYLE
EI IS NOTICING PERSONAL AND NATIONAL ECONOMIC TRENDS
EI MEANS YOU CANNOT CONTROL EVERYTHING
EI IS TAKING CARE OF ONE’S OWN HEALTH
EI MEANS KNOWING YOUR LUCK
There are several ways to categorize the themes as preparation for analytic memo writing. The first is to arrange them in outline format with superordinate and subordinate levels, based on how the themes seem to take organizational shape and structure. Simply cutting and pasting the themes in multiple arrangements on a word processor page eventually develops a sense of order to them. For example:
A second approach is to categorize the themes into similar clusters and to develop different category labels or theoretical constructs . A theoretical construct is an abstraction that transforms the central phenomenon’s themes into broader applications but can still use “is” and “means” as prompts to capture the bigger picture at work:
Theoretical Construct 1: EI Means Knowing the Unfortunate Present
Supporting Themes:
Theoretical Construct 2: EI is Cultivating a Small Fortune
Theoretical Construct 3: EI Means a Fortunate Future
What follows is an analytic memo generated from the cut-and-paste arrangement of themes into an outline and into theoretical constructs:
March 19, 2012 EMERGENT THEMES: FORTUNE/FORTUNATELY/UNFORTUNATELY I first reorganized the themes by listing them in two groups: “is” and “means.” The “is” statements seemed to contain positive actions and constructive strategies for economic intelligence. The “means” statements held primarily a sense of caution and restriction with a touch of negativity thrown in. The first outline with two major themes, LIVING AN INEXPENSIVE LIFESTYLE and YOU CANNOT CONTROL EVERYTHING also had this same tone. This reminded me of the old children’s picture book, Fortunately/Unfortunately , and the themes of “fortune” as a motif for the three theoretical constructs came to mind. Knowing the Unfortunate Present means knowing what’s (most) important and what’s (mostly) uncontrollable in one’s personal economic life. Cultivating a Small Fortune consists of those small money-saving actions that, over time, become part of one's lifestyle. A Fortunate Future consists of heightened awareness of trends and opportunities at micro and macro levels, with the understanding that health matters can idiosyncratically affect one’s fortune. These three constructs comprise this particular individual’s EI—economic intelligence.
Again, keep in mind that the examples above for coding and themeing were from one small interview transcript excerpt. The number of codes and their categorization would obviously increase, given a longer interview and/or multiple interviews to analyze. But the same basic principles apply: codes and themes relegated into patterned and categorized forms are heuristics—stimuli for good thinking through the analytic memo-writing process on how everything plausibly interrelates. Methodologists vary in the number of recommended final categories that result from analysis, ranging anywhere from three to seven, with traditional grounded theorists prescribing one central or core category from coded work.
QDA Strategy: To Assert
To assert in QDA is to put forward statements that summarize particular fieldwork and analytic observations that the researcher believes credibly represent and transcend the experiences.
Educational anthropologist Frederick Erickson (1986) wrote a significant and influential chapter on qualitative methods that outlined heuristics for assertion development . Assertions are declarative statements of summative synthesis, supported by confirming evidence from the data, and revised when disconfirming evidence or discrepant cases require modification of the assertions. These summative statements are generated from an interpretive review of the data corpus and then supported and illustrated through narrative vignettes—reconstructed stories from field notes, interview transcripts, or other data sources that provide a vivid profile as part of the evidentiary warrant.
Coding or themeing data can certainly precede assertion development as a way of gaining intimate familiarity with the data, but Erickson’s methods are a more admittedly intuitive yet systematic heuristic for analysis. Erickson promotes analytic induction and exploration of and inferences about the data, based on an examination of the evidence and an accumulation of knowledge. The goal is not to look for “proof” to support the assertions but plausibility of inference-laden observations about the local and particular social world under investigation.
Assertion development is the writing of general statements, plus subordinate yet related ones called subassertions , and a major statement called a key assertion that represents the totality of the data. One also looks for key linkages between them, meaning that the key assertion links to its related assertions, which then link to their respective subassertions. Subassertions can include particulars about any discrepant related cases or specify components of their parent assertions.
Excerpts from the interview transcript of our case study will be used to illustrate assertion development at work. By now, you should be quite familiar with the contents, so I will proceed directly to the analytic example. First, there is a series of thematically related statements the participant makes:
“Buy one package of chicken, get the second one free. Now that was a bargain. And I got some.”
“With Sweet Tomatoes I get those coupons for a few bucks off for lunch, so that really helps.”
“I don’t go to movies anymore. I rent DVDs from Netflix or Redbox or watch movies online—so much cheaper than paying over ten or twelve bucks for a movie ticket.”
Assertions can be categorized into low-level and high-level inferences . Low-level inferences address and summarize “what is happening” within the particulars of the case or field site—the “micro.” High-level inferences extend beyond the particulars to speculate on “what it means” in the more general social scheme of things—the “meso” or “macro.” A reasonable low-level assertion about the three statements above collectively might read: The participant finds several small ways to save money during a difficult economic period . A high-level inference that transcends the case to the macro level might read: Selected businesses provide alternatives and opportunities to buy products and services at reduced rates during a recession to maintain consumer spending.
Assertions are instantiated (i.e., supported) by concrete instances of action or participant testimony, whose patterns lead to more general description outside the specific field site. The author’s interpretive commentary can be interspersed throughout the report, but the assertions should be supported with the evidentiary warrant . A few assertions and subassertions based on the case interview transcript might read (and notice how high-level assertions serve as the paragraphs’ topic sentences):
Selected businesses provide alternatives and opportunities to buy products and services at reduced rates during a recession to maintain consumer spending. Restaurants, for example, need to find ways during difficult economic periods when potential customers may be opting to eat inexpensively at home rather than spending more money by dining out. Special offers can motivate cash-strapped clientele to patronize restaurants more frequently. An adult male dealing with such major expenses as underinsured dental care offers: “With Sweet Tomatoes I get those coupons for a few bucks off for lunch, so that really helps.” The film and video industries also seem to be suffering from a double-whammy during the current recession: less consumer spending on higher-priced entertainment, resulting in a reduced rate of movie theatre attendance (currently 39 percent of the American population, according to CNN); coupled with a media technology and business revolution that provides consumers less costly alternatives through video rentals and internet viewing: “I don’t go to movies anymore. I rent DVDs from Netflix or Redbox or watch movies online—so much cheaper than paying over ten or twelve bucks for a movie ticket.”
“Particularizability”—the search for specific and unique dimensions of action at a site and/or the specific and unique perspectives of an individual participant—is not intended to filter out trivial excess but to magnify the salient characteristics of local meaning. Although generalizable knowledge serves little purpose in qualitative inquiry since each naturalistic setting will contain its own unique set of social and cultural conditions, there will be some aspects of social action that are plausibly universal or “generic” across settings and perhaps even across time. To work toward this, Erickson advocates that the interpretive researcher look for “concrete universals” by studying actions at a particular site in detail, then comparing those to other sites that have also been studied in detail. The exhibit or display of these generalizable features is to provide a synoptic representation, or a view of the whole. What the researcher attempts to uncover is what is both particular and general at the site of interest, preferably from the perspective of the participants. It is from the detailed analysis of actions at a specific site that these universals can be concretely discerned, rather than abstractly constructed as in grounded theory.
In sum, assertion development is a qualitative data analytic strategy that relies on the researcher’s intense review of interview transcripts, field notes, documents, and other data to inductively formulate composite statements that credibly summarize and interpret participant actions and meanings, and their possible representation of and transfer into broader social contexts and issues.
QDA Strategy: To Display
To display in QDA is to visually present the processes and dynamics of human or conceptual action represented in the data.
Qualitative researchers use not only language but illustrations to both analyze and display the phenomena and processes at work in the data. Tables, charts, matrices, flow diagrams, and other models help both you and your readers cognitively and conceptually grasp the essence and essentials of your findings. As you have seen thus far, even simple outlining of codes, categories, and themes is one visual tactic for organizing the scope of the data. Rich text, font, and format features such as italicizing, bolding, capitalizing, indenting, and bullet pointing provide simple emphasis to selected words and phrases within the longer narrative.
“Think display” was a phrase coined by methodologists Miles and Huberman (1994) to encourage the researcher to think visually as data were collected and analyzed. The magnitude of text can be essentialized into graphics for “at-a-glance” review. Bins in various shapes and lines of various thicknesses, along with arrows suggesting pathways and direction, render the study as a portrait of action. Bins can include the names of codes, categories, concepts, processes, key participants, and/or groups.
As a simple example, Figure 28.1 illustrates the three categories’ interrelationship derived from process coding. It displays what could be the apex of this interaction, LIVING STRATEGICALLY, and its connections to THINKING STRATEGICALLY, which influences and affects SPENDING STRATEGICALLY.
Figure 28.2 represents a slightly more complex (if not playful) model, based on the five major in vivo codes/categories generated from analysis. The graphic is used as a way of initially exploring the interrelationship and flow from one category to another. The use of different font styles, font sizes, and line and arrow thicknesses are intended to suggest the visual qualities of the participant’s language and his dilemmas—a way of heightening in vivo coding even further.
Accompanying graphics are not always necessary for a qualitative report. They can be very helpful for the researcher during the analytic stage as a heuristic for exploring how major ideas interrelate, but illustrations are generally included in published work when they will help supplement and clarify complex processes for readers. Photographs of the field setting or the participants (and only with their written permission) also provide evidentiary reality to the write-up and help your readers get a sense of being there.
QDA Strategy: To Narrate
To narrate in QDA is to create an evocative literary representation and presentation of the data in the form of creative nonfiction.
All research reports are stories of one kind or another. But there is yet another approach to QDA that intentionally documents the research experience as story, in its traditional literary sense. Narrative inquiry plots and story lines the participant’s experiences into what might be initially perceived as a fictional short story or novel. But the story is carefully crafted and creatively written to provide readers with an almost omniscient perspective about the participants’ worldview. The transformation of the corpus from database to creative nonfiction ranges from systematic transcript analysis to open ended literary composition. The narrative, though, should be solidly grounded in and emerge from the data as a plausible rendering of social life.
A simple illustration of category interrelationship.
An illustration with rich text and artistic features.
The following is a narrative vignette based on interview transcript selections from the participant living through tough economic times:
Jack stood in front of the soft drink vending machine at work and looked almost worriedly at the selections. With both hands in his pants pockets, his fingers jingled the few coins he had inside them as he contemplated whether he could afford the purchase. One dollar and fifty cents for a twenty-ounce bottle of Diet Coke. One dollar and fifty cents. “I can practically get a two-liter bottle for that same price at the grocery store,” he thought. Then Jack remembered the upcoming dental surgery he needed—that would cost one thousand dollars—and the bottle of insulin and syringes he needed to buy for his diabetic, “high maintenance” cat—about one hundred and twenty dollars. He sighed, took his hands out of his pockets, and walked away from the vending machine. He was skipping lunch that day anyway so he could stock up on dinner later at the cheap-but-filling-all-you-can-eat Chinese buffet. He could get his Diet Coke there.
Narrative inquiry representations, like literature, vary in tone, style, and point of view. The common goal, however, is to create an evocative portrait of participants through the aesthetic power of literary form. A story does not always have to have a moral explicitly stated by its author. The reader reflects on personal meanings derived from the piece and how the specific tale relates to one’s self and the social world.
QDA Strategy: To Poeticize
To poeticize in QDA is to create an evocative literary representation and presentation of the data in the form of poetry.
One form for analyzing or documenting analytic findings is to strategically truncate interview transcripts, field notes, and other pertinent data into poetic structures. Like coding, poetic constructions capture the essence and essentials of data in a creative, evocative way. The elegance of the format attests to the power of carefully chosen language to represent and convey complex human experience.
In vivo codes (codes based on the actual words used by participants themselves) can provide imagery, symbols, and metaphors for rich category, theme, concept, and assertion development, plus evocative content for arts-based interpretations of the data. Poetic inquiry takes note of what words and phrases seem to stand out from the data corpus as rich material for reinterpretation. Using some of the participant’s own language from the interview transcript illustrated above, a poetic reconstruction or “found poetry” might read:
Scary Times Scary times... spending more (another ding in my wallet) a couple of thousand (another ding in my wallet) insurance is just worthless (another ding in my wallet) pick up the tab (another ding in my wallet) not putting as much into savings (another ding in my wallet) It all adds up. Think twice: don't really need skip Think twice, think cheap: coupons bargains two-for-one free Think twice, think cheaper: stock up all-you-can-eat (cheap—and filling) It all adds up.
Anna Deavere Smith, a verbatim theatre performer, attests that people speak in forms of “organic poetry” in everyday life. Thus in vivo codes can provide core material for poetic representation and presentation of lived experiences, potentially transforming the routine and mundane into the epic. Some researchers also find the genre of poetry to be the most effective way to compose original work that reflects their own fieldwork experiences and autoethnographic stories.
QDA Strategy: To Compute
To compute in QDA is to employ specialized software programs for qualitative data management and analysis.
CAQDAS is an acronym for Computer Assisted Qualitative Data Analysis Software. There are diverse opinions among practitioners in the field about the utility of such specialized programs for qualitative data management and analysis. The software, unlike statistical computation, does not actually analyze data for you at higher conceptual levels. CAQDAS software packages serve primarily as a repository for your data (both textual and visual) that enable you to code them, and they can perform such functions as calculate the number of times a particular word or phrase appears in the data corpus (a particularly useful function for content analysis) and can display selected facets after coding, such as possible interrelationships. Certainly, basic word-processing software such as Microsoft Word, Excel, and Access provide utilities that can store and, with some pre-formatting and strategic entry, organize qualitative data to enable the researcher’s analytic review. The following internet addresses are listed to help in exploriong these CAQDAS packages and obtaining demonstration/trial software and tutorials:
AnSWR: www.cdc.gov/hiv/topics/surveillance/resources/software/answr
ATLAS.ti: www.atlasti.com
Coding Analysis Toolkit (CAT): cat.ucsur.pitt.edu/
Dedoose: www.dedoose.com
HyperRESEARCH: www.researchware.com
MAXQDA: www.maxqda.com
NVivo: www.qsrinternational.com
QDA Miner: www.provalisresearch.com
Qualrus: www.qualrus.com
Transana (for audio and video data materials): www.transana.org
Weft QDA: www.pressure.to/qda/
Some qualitative researchers attest that the software is indispensable for qualitative data management, especially for large-scale studies. Others feel that the learning curve of CAQDAS is too lengthy to be of pragmatic value, especially for small-scale studies. From my own experience, if you have an aptitude for picking up quickly on the scripts of software programs, explore one or more of the packages listed. If you are a novice to qualitative research, though, I recommend working manually or “by hand” for your first project so you can focus exclusively on the data and not on the software.
QDA Strategy: To Verify
To verify in QDA is to administer an audit of “quality control” to your analysis.
After your data analysis and the development of key findings, you may be thinking to yourself, “Did I get it right?” “Did I learn anything new?” Reliability and validity are terms and constructs of the positivist quantitative paradigm that refer to the replicability and accuracy of measures. But in the qualitative paradigm, other constructs are more appropriate.
Credibility and trustworthiness ( Lincoln & Guba, 1985 ) are two factors to consider when collecting and analyzing the data and presenting your findings. In our qualitative research projects, we need to present a convincing story to our audiences that we “got it right” methodologically. In other words, the amount of time we spent in the field, the number of participants we interviewed, the analytic methods we used, the thinking processes evident to reach our conclusions, and so on should be “just right” to persuade the reader that we have conducted our jobs soundly. But remember that we can never conclusively “prove” something; we can only, at best, convincingly suggest. Research is an act of persuasion.
Credibility in a qualitative research report can be established through several ways. First, citing the key writers of related works in your literature review is a must. Seasoned researchers will sometimes assess whether a novice has “done her homework” by reviewing the bibliography or references. You need not list everything that seminal writers have published about a topic, but their names should appear at least once as evidence that you know the field’s key figures and their work.
Credibility can also be established by specifying the particular data analytic methods you employed (e.g., “Interview transcripts were taken through two cycles of process coding, resulting in five primary categories”), through corroboration of data analysis with the participants themselves (e.g., “I asked my participants to read and respond to a draft of this report for their confirmation of accuracy and recommendations for revision”) or through your description of how data and findings were substantiated (e.g., “Data sources included interview transcripts, participant observation field notes, and participant response journals to gather multiple perspectives about the phenomenon”).
Creativity scholar Sir Ken Robinson is attributed with offering this cautionary advice about making a convincing argument: “Without data, you’re just another person with an opinion.” Thus researchers can also support their findings with relevant, specific evidence by quoting participants directly and/or including field note excerpts from the data corpus. These serve both as illustrative examples for readers and to present more credible testimony of what happened in the field.
Trustworthiness , or providing credibility to the writing, is when we inform the reader of our research processes. Some make the case by stating the duration of fieldwork (e.g., “Seventy-five clock hours were spent in the field”; “The study extended over a twenty-month period”). Others put forth the amounts of data they gathered (e.g., “Twenty-seven individuals were interviewed”; “My field notes totaled approximately 250 pages”). Sometimes trustworthiness is established when we are up front or confessional with the analytic or ethical dilemmas we encountered (e.g., “It was difficult to watch the participant’s teaching effectiveness erode during fieldwork”; “Analysis was stalled until I recoded the entire data corpus with a new perspective.”).
The bottom line is that credibility and trustworthiness are matters of researcher honesty and integrity . Anyone can write that he worked ethically, rigorously, and reflexively, but only the writer will ever know the truth. There is no shame if something goes wrong with your research. In fact, it is more than likely the rule, not the exception. Work and write transparently to achieve credibility and trustworthiness with your readers.
The length of this article does not enable me to expand on other qualitative data analytic strategies, such as to conceptualize, abstract, theorize, and write. Yet there are even more subtle thinking strategies to employ throughout the research enterprise, such as to synthesize, problematize, persevere, imagine, and create. Each researcher has his or her own ways of working, and deep reflection (another strategy) on your own methodology and methods as a qualitative inquirer throughout fieldwork and writing provides you with metacognitive awareness of data analytic processes and possibilities.
Data analysis is one of the most elusive processes in qualitative research, perhaps because it is a backstage, behind-the-scenes, in-your-head enterprise. It is not that there are no models to follow. It is just that each project is contextual and case specific. The unique data you collect from your unique research design must be approached with your unique analytic signature. It truly is a learning-by-doing process, so accept that and leave yourself open to discovery and insight as you carefully scrutinize the data corpus for patterns, categories, themes, concepts, assertions, and possibly new theories through strategic analysis.
Auerbach, C. F. , & Silverstein, L. B. ( 2003 ). Qualitative data: An introduction to coding and analysis . New York: New York University Press.
Google Scholar
Google Preview
Birks, M. , & Mills, J. ( 2011 ). Grounded theory: A practical guide . London: Sage.
Boyatzis, R. E. ( 1998 ). Transforming qualitative information: Thematic analysis and code development . Thousand Oaks, CA: Sage.
Bryant, A. , & Charmaz, K. (Eds.). ( 2007 ). The Sage handbook of grounded theory . London: Sage.
Charmaz, K. ( 2006 ). Constructing grounded theory: A practical guide through qualitative analysis . Thousand Oaks, CA: Sage.
Erickson, F. ( 1986 ). Qualitative methods in research on teaching. In M. C. Wittrock (Ed.), Handbook of research on teaching (3rd ed.) (pp. 119–161). New York: Macmillan.
Geertz, C. ( 1983 ). Local knowledge: Further essays in interpretive anthropology . New York: Basic Books.
Gibbs, G. R. ( 2007 ). Analysing qualitative data . London: Sage.
Lincoln, Y. S. , & Guba, E. G. ( 1985 ). Naturalistic inquiry . Newbury Park, CA: Sage.
Miles, M. B. , & Huberman, A. M. ( 1994 ). Qualitative data analysis (2nd ed.). Thousand Oaks, CA: Sage.
Saldaña, J. ( 2009 ). The coding manual for qualitative researchers . London: Sage.
Saldaña, J. ( 2011 ). Fundamentals of qualitative research . New York: Oxford University Press.
Saldaña, J. ( 2013 ). The coding manual for qualitative researchers (2nd ed.). London: Sage.
Shank, G. ( 2008 ). Abduction. In L. M. Given (Ed.), The Sage encyclopedia of qualitative research methods (pp. 1–2). Thousand Oaks, CA: Sage.
Stake, R. E. ( 1995 ). The art of case study research . Thousand Oaks, CA: Sage.
Stern, P. N. , & Porr, C. J. ( 2011 ). Essentials of accessible grounded theory . Walnut Creek, CA: Left Coast Press.
Strauss, A. L. ( 1987 ). Qualitative analysis for social scientists . Cambridge: Cambridge University Press.
Sunstein, B. S. , & Chiseri-Strater, E. ( 2012 ). FieldWorking: Reading and writing research (4th ed.). Boston: Bedford/St. Martin’s.
Wertz, F. J. , Charmaz, K. , McMullen, L. M. , Josselson, R. , Anderson, R. , & McSpadden, E. ( 2011 ). Fives ways of doing qualitative analysis: Phenomenological psychology, grounded theory, discourse analysis, narrative research, and intuitive inquiry . New York: Guilford.
- About Oxford Academic
- Publish journals with us
- University press partners
- What we publish
- New features
- Open access
- Institutional account management
- Rights and permissions
- Get help with access
- Accessibility
- Advertising
- Media enquiries
- Oxford University Press
- Oxford Languages
- University of Oxford
Oxford University Press is a department of the University of Oxford. It furthers the University's objective of excellence in research, scholarship, and education by publishing worldwide
- Copyright © 2024 Oxford University Press
- Cookie settings
- Cookie policy
- Privacy policy
- Legal notice
This Feature Is Available To Subscribers Only
Sign In or Create an Account
This PDF is available to Subscribers Only
For full access to this pdf, sign in to an existing account, or purchase an annual subscription.
Coding Qualitative Data
- First Online: 02 January 2023
Cite this chapter

- Marla Rogers 4
Part of the book series: Springer Texts in Education ((SPTE))
4508 Accesses
With the advent and proliferation of analysis software (e.g., Nvivo, Atlas.ti), coding data has become much easier in terms of application. Where autocoding algorithms do much to assist and enlighten a researcher in analysis, coding qualitative data remains an act that must largely be undertaken by a human in order to fully address the research question(s) (Kaufmann, A. A., Barcomb, A., & Riehle, D. (2020). Supporting interview analysis with autocoding. HICSS. https://www.semanticscholar.org/paper/Supporting-Interview-Analysis-with-Autocoding-Kaufmann-Barcomb/b6e045859b5ce94e1eb144a9545b26c5e9fa6f32 ). Even seasoned qualitative researchers can find the process of coding their datum corpus to be arduous at times. For novice researchers, the task can quickly become baffling and overwhelming.
This is a preview of subscription content, log in via an institution to check access.
Access this chapter
- Available as PDF
- Read on any device
- Instant download
- Own it forever
- Available as EPUB and PDF
- Compact, lightweight edition
- Dispatched in 3 to 5 business days
- Free shipping worldwide - see info
Tax calculation will be finalised at checkout
Purchases are for personal use only
Institutional subscriptions
Anonymous Author. (2019, July 2). Resolve: Finding a resolution for infertility: Infertility support group and discussion community [online discussion post]. https://www.inspire.com/
Basit, T. N. (2003). Manual or electronic? The role of coding in qualitative data analysis. Educational Research, 45 (2), 143–154.
Article Google Scholar
Braun, V., & Clarke, V. (2006). Using thematic analysis in psychology. Qualitative Research in Psychology, 3 (2), 77–101.
Caulfield, J. (2019, September 6). How to do thematic analysis . www.scribbr.com/methodology/thematicanalysis
Creswell, J. (2015). 30 Essential skills for the qualitative researcher . SAGE.
Google Scholar
Elliot, V. (2018). Thinking about the coding process in qualitative data analysis. The Qualitative Report, 23 (11), 2850–2861. https://nsuworks.nova.edu/tqr/vol23/iss11/14
Kaufmann, A. A., Barcomb, A., & Riehle, D. (2020). Supporting interview analysis with autocoding. HICSS. https://www.semanticscholar.org/paper/Supporting-Interview-Analysis-with-Autocoding-Kaufmann-Barcomb/b6e045859b5ce94e1eb144a9545b26c5e9fa6f32
Saldana, J. (2009). The coding manual for qualitative researchers. SAGE.
Further Readings
Analyzing Qualitative Data: Nvivo 12 Pro for Windows (2 hours). https://www.youtube.com/watch?v=CKPS4LF9G8A
How to Analyze Interview Transcripts. (2 minutes). https://www.rev.com/blog/analyze-interview-transcripts-in-qualitative-research
How to Know You Are Coding Correctly (4 minutes). https://www.youtube.com/watch?v=iL7Ww5kpnIM
Download references
Author information
Authors and affiliations.
University of Saskatchewan, Saskatoon, Canada
Marla Rogers
You can also search for this author in PubMed Google Scholar
Corresponding author
Correspondence to Marla Rogers .
Editor information
Editors and affiliations.
Department of Educational Administration, College of Education, University of Saskatchewan, Saskatoon, SK, Canada
Janet Mola Okoko
Scott Tunison
Department of Educational Administration, University of Saskatchewan, Saskatoon, SK, Canada
Keith D. Walker
Rights and permissions
Reprints and permissions
Copyright information
© 2023 The Author(s), under exclusive license to Springer Nature Switzerland AG
About this chapter
Rogers, M. (2023). Coding Qualitative Data. In: Okoko, J.M., Tunison, S., Walker, K.D. (eds) Varieties of Qualitative Research Methods. Springer Texts in Education. Springer, Cham. https://doi.org/10.1007/978-3-031-04394-9_12
Download citation
DOI : https://doi.org/10.1007/978-3-031-04394-9_12
Published : 02 January 2023
Publisher Name : Springer, Cham
Print ISBN : 978-3-031-04396-3
Online ISBN : 978-3-031-04394-9
eBook Packages : Education Education (R0)
Share this chapter
Anyone you share the following link with will be able to read this content:
Sorry, a shareable link is not currently available for this article.
Provided by the Springer Nature SharedIt content-sharing initiative
- Publish with us
Policies and ethics
- Find a journal
- Track your research

Coding Qualitative Data: A Beginner’s How-To + Examples

When gathering feedback, whether it’s from surveys , online reviews, or social mentions , the most valuable insights usually come from free-form or open-ended responses.
Though these types of responses allow for more detailed feedback, they are also difficult to measure and analyse on a large scale. Coding qualitative data allows you to transform these unique responses into quantitative metrics that can be compared to the rest of your data set.
Read on to learn about this process.
What is Qualitative Data Coding?

Qualitative data coding is the process of assigning quantitative tags to the pieces of data. This is necessary for any type of large-scale analysis because you 1) need to have a consistent way to compare and contrast each piece of qualitative data, and 2) will be able to use tools like Excel and Google Sheets to manipulate quantitative data.
For example, if a customer writes a Yelp review stating “The atmosphere was great for a Friday night, but the food was a bit overpriced,” you can assign quantitative tags based on a scale or sentiment. We’ll get into how exactly to assign these tags in the next section.
Inductive Coding vs Deductive Coding

When deciding how you will scale and code your data, you’ll first have to choose between the inductive or deductive methods. We cover the pros and cons of each method below.
Inductive Coding
Inductive coding is when you don’t already have a set scale or measurement with which to tag the data. If you’re analysing a large amount of qualitative data for the first time, such as the first round of a customer feedback survey, then you will likely need to start with inductive coding since you don’t know exactly what you will be measuring yet.
Inductive coding can be a lengthy process, as you’ll need to comb through your data manually. Luckily, things get easier the second time around when you’re able to use deductive coding.
Deductive Coding
Deductive coding is when you already have a predetermined scale or set of tags that you want to use on your data. This is usually if you’ve already analysed a set of qualitative data with inductive reasoning and want to use the same metrics.
To continue from the example above, say you noticed in the first round that a lot of Yelp reviews mentioned the price of food, and, using inductive coding, you were able to create a scale of 1-5 to measure appetisers, entrees, and desserts.
When analysing new Yelp reviews six months later, you’ll be able to keep the same scale and tag the new responses based on deductive coding, and therefore compare the data to the first round of analysis.
3 Steps for Coding Qualitative Data From the Top-Down

For this section, we will assume that we’re using inductive coding.
1. Start with Broad Categories
The first thing you will want to do is sort your data into broad categories. Think of each of these categories as specific aspects you want to know more about.
To continue with the restaurant example, your categories could include food quality, food price, atmosphere, location, service, etc.
Or for a business in the B2B space, your categories could look something like product quality, product price, customer service, chatbot quality, etc.
2. Assign Emotions or Sentiments
The next step is to then go through each category and assign a sentiment or emotion to each piece of data. In the broadest terms, you can start with just positive emotion and negative emotion.
Remember that when using inductive coding, you’re figuring out your scale and measurements as you go, so you can always start with broad analysis and drill down deeper as you become more familiar with your data.
3. Combine Categories and Sentiments to Draw Conclusions
Once you’ve sorted your data into categories and assigned sentiments, you can start comparing the numbers and drawing conclusions.
For example, perhaps you see that out of the 500 Yelp reviews you’ve analysed, 300 fall into the food price/negative sentiment section of your data. That’s a pretty clear indication that customers think your food is too expensive, and you may see an improvement in customer retention by dropping prices.
The three steps outlined above cover just the very basics of coding qualitative data, so you can understand the theory behind the analysis.
In order to gain more detailed conclusions, you’ll likely need to dig deeper into the data by assigning more complex sentiment tags and breaking down the categories further. We cover some useful tips and a coding qualitative data example below.
4 Tips to Keep in Mind for Accurate Qualitative Data Coding

Here are some helpful reminders to keep on hand when going through the three steps outlined above.
1. Start with a Small Sample of the Data
You’ll want to start with a small sample of your data to make sure the tags you’re using will be applicable to the rest of the set. You don’t want to waste time by going through and manually tagging each piece of data, only to realise at the end that the tags you’ve been using actually aren’t accurate.
Once you’ve broken up your qualitative data into the different categories, choose 10-20% of responses in each category to tag using inductive coding.
Then, continue onto the analysis phase using just that 10-20%.
If you’re able to find takeaways and easily compare the data with that small sample size , then you can continue coding the rest of the data in that same way, adding additional tags where needed.
2. Use Numerical Scales for Deeper Analysis
Instead of just assigning positive and negative sentiments to your data points, you can break this down even further by utilising numerical scales.
Exactly how negative or how positive was the piece of feedback? In the Yelp review example from the beginning of this article, the reviewer stated that the food was “a bit overpriced.” If you’re using a scale of 1-5 to tag the category “food price,” you could tag this as a ⅗ rating.
You’ll likely need to adjust your scales as you work through your initial sample and get a clearer picture of the review landscape.
Having access to more nuanced data like this is important for making accurate decisions about your business.
If you decided to stick with just positive and negative tags, your “food price” category might end up being 50% negative, indicating that a massive change to your pricing structure is needed immediately.
But if it turns out that most of those negative reviews are actually ⅗’s and not ⅕’s, then the situation isn’t as dire as it might have appeared at first glance.
3. Remember That Each Data Point Can Contain Multiple Pieces of Information
Remember that qualitative data can have multiple sentiments and multiple categories (such as the Yelp review example mentioning both atmosphere and price), so you may need to double or even triple-sort some pieces of data.
That’s the beauty of and the struggle with handling open-ended or free-form responses.
However, these responses allow for more accurate insights into your business vs narrow multiple-choice questions.
4. Be Mindful of Having Too Many Tags
Remember, you’re able to draw conclusions from your qualitative data by combining category tags and sentiment tags.
An easy mistake for data analysis newcomers to make is to end up with so many tags that comparing them becomes impossible. This usually stems from an overabundance of caution that you’re tagging responses accurately.
For example, say you’re tagging a review that’s discussing a restaurant host’s behavior. You put it in the category “host/hostess behavior” and tag it as a ⅗ for the sentiment.
Then, you come across another review discussing a server’s behaviour that’s slightly more positive, so you tag this as “server behaviour” for the category and 3.75/5 for the sentiment.
By getting this granular, you’re going to end up with very few data points in the same category and sentiment, which defeats the purpose of coding qualitative data.
In this example, unless you’re very specifically looking at the behaviour of individual restaurant positions, you’re better off tagging both responses as “customer service” for the category and ⅗ for the sentiment for consistency’s sake.
Coding Qualitative Data Example
Below we’ll walk through an example of coding qualitative data, utilising the steps and tips detailed above.

Step 1: Read through your data and define your categories. For this example, we’ll use “customer service,” “product quality,” and “price.”
Step 2: Sort a sample of the data into the above categories. Remember that each data point can be included in multiple categories.
- “This software is amazing, does exactly what I need it to [Product Quality]. However, I do wish they’d stop raising prices every year as it’s starting to get a little out of my budget [Price].”
- “Love the product [Product Quality], but honestly I can’t deal with the terrible customer service anymore [Customer Service]. I’ll be shopping around for a new solution.”
- “Meh, this software is okay [Product Quality] but cheaper competitors [Price] are just as good with much better customer service [Customer Service].”
Step 3: Assign sentiments to the sample. For more in-depth analysis, use a numerical scale. We’ll use 1-5 in this example, with 1 being the lowest satisfaction and 5 being the highest.
- Product Quality:
- “This software is amazing, does exactly what I need it to do” [5/5]
- “Love the product” [5/5]
- “Meh, this software is okay [⅖]
- Customer Service:
- “Honestly I can’t deal with the terrible customer service anymore [⅕]
- “...Much better customer service,” [⅖]
- “However, I do wish they’d stop raising prices every year as it’s starting to get a little out of my budget.” [⅗]
- “Cheaper competitors are just as good.” [⅖]
Step 4: After confirming that the established category and sentiment tags are accurate, continue steps 1-3 for the rest of your data, adding tags where necessary.
Step 5: Identify recurring patterns using data analysis. You can combine your insights with other types of data , like demographic and psychographic customer profiles.
Step 6: Take action based on what you find! For example, you may discover that customers aged 20-30 were the most likely to provide negative feedback on your customer service team, equating to ⅖ or ⅕ on your coding scale. You may be able to conclude that younger customers need a more streamlined way to communicate with your company, perhaps through an automated chatbot service.
Step 7: Repeat this process with more specific research goals in mind to continue digging deeper into what your customers are thinking and feeling . For example, if you uncover the above insight through coding qualitative data from online reviews, you could send out a customer feedback survey specifically asking free-form questions about how your customers would feel interacting with a chatbot instead.
How AI tools help with Coding Qualitative Data

Now that you understand the work that goes into coding qualitative data, you’re probably wondering if there’s an easier solution than manually sorting through every response.
The good news is that, yes, there is. Advanced AI-backed tools are available to help companies quickly and accurately analyse qualitative data at scale, such as customer surveys and online reviews.
These tools can not only code data based on a set of rules you determine, but they can even do their own inductive coding to determine themes and create the most accurate tags as they go.
These capabilities allow business owners to make accurate decisions about their business based on actual data and free up the necessary time and employee bandwidth to act on these insights.
The infographic below gives a visual summary of how to code qualitative data and why it’s essential for businesses to learn how:

Try Chattermill today today to learn how our AI-powered software can help you make smarter business decisions.
Related articles.
What to do if you are number 2 in the market
We look at what to do if you are the number 2 brand in the market...and provide a word of caution to market leaders.
.jpg "what is data coding in qualitative research")
Available Now: CX Intelligence Academy from Chattermill
We’re launching a brand new set of resources built to help you prove the value of CX, and become a better, more data-driven CX expert.

Want AI to make your breakfast for you?
AI can do everything, right? In this post, we explore how even the most sophisticated technology alone, won't solve everything - especially the challenges faced by CX and customer insights professionals.
See Chattermill in action
Understand the voice of your customers in realtime with Customer Feedback Analytics from Chattermill.
- Technical Support
- Find My Rep
You are here
The Coding Manual for Qualitative Researchers
- Johnny Saldana - Arizona State University, USA
- Description
“ Especially useful for utilization in higher education, administrative research, general development, the arts, social sciences, nursing, business, and health care. That may seem like a vast application, but both students and professionals will appreciate the clarity and the emblematic mentorship this book provides. ” – American Journal of Qualitative Research
This invaluable manual from world-renowned expert Johnny Saldaña illuminates the process of qualitative coding and provides clear, insightful guidance for qualitative researchers at all levels. The fourth edition includes a range of updates that build upon the huge success of the previous editions:
- A structural reformat has increased accesibility; the 3 sections from the previous edition are now spread over 15 chapters for easier sectional reference
- There are two new first cycle coding methods join the 33 others in the collection: Metaphor Coding and Themeing the Data: Categorically
- Includes a brand new companion website with links to SAGE journal articles, sample transcripts, links to CAQDAS sites, student exercises, links to video and digital content
- Analytic software screenshots and academic references have been updated, alongside several new figures added throughout the manual
Saldana presents a range of coding options with advantages and disadvantages to help researchers to choose the most appropriate approach for their project, reinforcing their perspective with real world examples, used to show step-by-step processes and to demonstrate important skills
See what’s new to this edition by selecting the Features tab on this page. Should you need additional information or have questions regarding the HEOA information provided for this title, including what is new to this edition, please email [email protected] . Please include your name, contact information, and the name of the title for which you would like more information. For information on the HEOA, please go to http://ed.gov/policy/highered/leg/hea08/index.html .
For assistance with your order: Please email us at [email protected] or connect with your SAGE representative.
SAGE 2455 Teller Road Thousand Oaks, CA 91320 www.sagepub.com
Supplements
This coding manual is the best go-to text for qualitative data analysis, both for a manual approach and for computer-assisted analysis. It offers a range of coding strategies applicable to any research projects, written in accessible language, making this text highly practical as well as theoretically comprehensive.
With this expanded fourth edition of The Coding Manual for Qualitative Researchers, Saldaña has proved to be an exemplary archivist of the field of qualitative methods, whilst never losing sight of the practical issues involved in inducting new researchers to the variety of coding methods available to them. His text provides great worked examples which build up understanding, skills and confidence around coding for the new researcher, whilst also enhancing established researchers’ grasp of the key principles of coding.
Johnny Saldaña’s Coding Manual for Qualitative Researcher s has been an indispensable resource for students, teachers and practitioners since it was first published in 2009. With its expanded contents, new coding methods and more intuitive structure, the fourth edition deserves a prominent place on every qualitative researcher’s bookshelf.
An essential text for qualitative research training and fieldwork. Along with updated examples and applications, Saldaña's fourth edition introduces multiple new coding methods, solidifying this as the most comprehensive, practical qualitative coding guide on the market today.
This book really is the coding manual for qualitative researchers, both aspiring and seasoned. The text is well-organized and thorough. With several new methods included in the fourth edition, this is an essential reference text for qualitative analysts.
This book will be of particular help to PhD students rather than masters.
This will be of particular help to PhD students rather than Masters
Great update to the third addition.
This is a great resource for qualitative researchers of all levels. It gives clear details on different ways to code, it gives clear examples, and there are citations of others who have used that type of coding. It is great for use in the methods section of articles. It is also valuable for introducing graduate students different ways to code. It is an indispensable resource.
Excellent resource for learning how to analyze qualitative data.
- Over 30 techniques are now included
- A brand new companion website with links to SAGE journal articles, sample transcripts, links to CAQDAS sites, student exercises, links to video and digital content
Preview this book
For instructors, select a purchasing option, related products.

Chapter 19. Advanced Codes and Coding
Introduction: forest and trees.
Chapter 17 introduced you to content analysis, a particular way of analyzing historical artifacts, media, and other such “content” for its communicative aspects. Chapter 18 introduced you to the more general process of data analysis for qualitative research, how you would go about beginning to organize, simplify, and code interview transcripts and fieldnotes. This chapter takes you a bit deeper into the specifics of codes and how to use them, particularly the later stages of coding, in which our codes are refined, simplified, combined, and organized for the purpose of identifying what it all means , theoretically. These later rounds of coding are essential to getting the most out of the data we’ve collected. By the end of the chapter, you should understand how “findings” are actually found.

I am going to use a particular analogy throughout this chapter, that of the relationship between the forest and trees. You know the saying “You can’t see the forest for the trees”? Think about what this actually means. One is so focused on individual trees that one neglects to notice the overall system of which the trees are a part. This is something beginning researchers do all the time, and the laborious process of coding can make this tendency worse. You focus on the details of your codes but forget that they are merely the first step in the analysis process, that after you have tagged your trees, you need to step back and look at the big picture that is the entire forest. Keep this metaphor in mind. We will come back to it a few times.
Let’s imagine you have interviewed fifty college students about their experiences during the pandemic, both as students and as workers. Each of these interviews has been transcribed and runs to about 35 pages, double-spaced. That is 1,750 pages of data you will need to code before you can properly begin to make sense of it all. Taking a sample of the interviews for a first round of coding (see chapter 17), you are likely to first note things that are common to the interviews. A general feeling of fear, anxiety, or frustration may jump out at you. There is something about the human brain that is primed to look for “the one common story” at the outset. Often, we are wrong about this. The process of coding and recoding and memoing will often show us that our initial takes on “what the data say” are seriously misleading for a couple of reasons: first, because voices or stories that counter the predominant theme are often ignored in the first round, and, second, because what startles us or surprises us can drive away the more mundane findings that actually are at the heart of what the data are saying. If we have experienced the pandemic with little anxiety, seeing anxiety in the interviews will surprise us and make us overstate its importance in general. If we expect to find something and we see something very different, we tend to overnotice that difference. This is basic psychology, I am sure.
This is where coding comes in to help you verify, amplify, complicate, or delimit your initial first impressions. Coding is a rigorous process because it helps us move away from preconceptions and other judgment errors and pin down what is actually present in the data. It helps you identify the trees, which is actually important before we can properly see the forest. We start with “It’s a forest” (not really that helpful), then move to “These are specific trees, with particular roots and branches,” and finally move back to a better understanding of the forest (“It’s a boreal forest that works like this…”). Coding is the rigorous connecting process between the first (often wrong or incomplete) impression and the final interpretation, the “results” of the study (figure 19.1). If you remember that this is the point of coding, you will be less likely to get lost in the woods. Coding is not about tagging every possible root and branch of every tree to create some kind of master compendium of forest particulars. Coding is about learning how to identify what is important about that forest overall. [1] When you are new to the forest, you won’t know which root or branch is of importance, but as you walk through it again and again, you will learn to appreciate its rhythms and know what to pick up as important and what to discard as irrelevant.

There is no single correct way to go about coding your data. When I first began teaching qualitative research methods, I resolutely refused to “teach” coding, as I thought it was a little like trying to teach people to write fiction. It’s very personal and best developed through practice. But I have come to see the value of providing some guidelines—maps through the forest, if you will. I have drawn heavily here from Johnny Saldaña’s extensive and beautiful “coding manual,” but the particular suggestions here are what have worked best for me. We are going to walk through the forest many times, first in an open exploratory way and then in a more focused way once we have found our stride. Finally, we will sit down with all of our maps and materials and see what it is we can discover about the world by looking at our data.
First Walks in the Woods: Open Coding
Saldaña ( 2014 ) provides dozens of types of codes and coding processes, but we are going to confine our discussion two five. These are the five kinds of codes that I think work best for beginning researchers in your first walks through the woods. Used together, they have the potential to get at the heart of what is important in social science research. They are descriptive , i n vivo , process , values , and emotions . Select a sample of your data in the first round of coding. If you tried to tag everything in these initial rounds, you will never get out of the woods. Your sample should be broad enough to capture essential aspects of your data corpus but small enough to allow you free rein to pick up as many branches as you think interesting. Set aside a significant amount of time for this. And then double or triple that time allotment. You’ll need it.
Descriptive codes are codes used to tag specific activities, places, and things that seem to be important in particular passages. They are identifying tags (“This is a branch from an elm tree”; “This is an acorn”). Be careful here because you can really end up trying to identify everything—every word, every line, every passage. Don’t do that! It’s helpful to remind yourself what your research is about—what is your research question or focus? Some twigs can stay on the forest floor. Saldaña’s ( 2014 ) use of the term is narrower. Descriptive codes are meant to summarize the basic topic of a passage in a single word or short phrase, what is also called “topic coding” or “index coding.” These descriptive codes will allow you to easily search for and return to passages about a particular topic or feature of the forest; this will allow you to make better comparisons in later rounds of analysis. The actual word or phrase you come up with will be rather personal to you and dependent on the focus of your research. Here is an exemplary passage from a fictitious interview with a working-class college student: “I had no idea what scholarships were available! No one in my family had ever gone to college before, so there was no one I could ask. And my high school counselor was always too busy. What a joke! Plus, I was a little embarrassed, to be honest. So, yeah, I owe a lot of money. It’s really not that fair.”
What descriptive codes can be developed here? How would you define the topic or topics of this passage? On the one hand, the subject appears to be scholarships or how this student paid for college. “How Pay” might be a good descriptive code for the entire passage. But there are a lot of other interesting things going on here too. If your focus is on how peer groups work or social networks, you might focus on those aspects of the passage. Perhaps “No Assistance” could work as a descriptive code in this first round of coding. Descriptive codes are pretty straightforward, so they are easy for beginning researchers to use, but “they may not enable more complex and theoretical analyses as the study progresses, particularly with interview transcript data” ( 137 ).
In vivo codes are codes that use the actual words people have used to tag an important point or message. In the above passage, “no one I could ask” might be such a code. These indigenous terms or phrases are particularly useful when seeking to “honor or prioritize” the voice of the participants ( Saldaña 2014:138 ). They don’t require you to impose your own sense on a passage. They are also rather enjoyable to generate, as they encourage you to step into the shoes of those you have interviewed or observed. The terms or phrases should jump out at you as something salient to your research question or focus (or simply jump out at you in surprising ways that you hadn’t expected, given your research question).
Process codes are codes that label conceptual actions. This is another way to describe the data, but rather than focus on the topic, we organize it around key actions and activities. For example, we could tag the passage above with “asking for help.” By convention, process codes are gerunds , those strange verb forms that end in -ing and operate a bit like nouns. Process codes are particularly helpful for studies that focus on change and development over time, as the use of tagged gerunds can really highlight stages, if such exist. Grounded theorists often employ process codes for this reason. I find it useful, as it reminds me to focus not only on what participants say and how they say it but on the activities that they are engaged in.
Values codes are codes that reflect the attitudes, beliefs, or values held by a participant. Values codes capture things such as principles, moral codes and situational norms (“values”), the way we think about ourselves and others (“attitudes”), and all of our personal knowledge, experience, opinions, assumptions, biases, prejudices, morals, and other interpretive perceptions of the world (“beliefs”). They are extremely powerful tags and absolutely essential for phenomenological researchers. We might attach the values code “unfair” to the passage above or even note the “What a joke!” passage as disbelief or disgust.
Values codes are a particular subset of affective coding , where codes are developed to “investigate subjective qualities of human experience (e.g., emotions, values, conflicts, judgments) by directly acknowledging and naming those experiences” ( Saldaña 2014:159 ). The fifth suggested code is also another form of affective coding, emotions codes , labels of feelings shared by the participants. “Embarrassment” is an obvious emotion code in the above passage. In the kinds of research I mostly do, phenomenological and interview based, often about sensitive subjects around discrimination, power, and marginalization, coding emotions is incredibly helpful and productive: “Emotion coding is appropriate for virtually all qualitative studies, but particularly for those that explore intrapersonal or interpersonal participant experiences and actions, especially in matters of identity, social relationships, reasoning, decision-making, judgment, and risk-taking” ( 160 ).

A Final Purposeful Hike through the Forest: Closed Coding
After initial rounds of coding (several walks through the woods), you should begin to see important themes emerge from your data and have a general idea of what is important enough to look at more closely. Between first-cycle coding and your last hike through the forest, you will have created a list of codes or even a codebook that records these emergent categories and themes (see chapter 18). It is quite possible your research question(s) or focus has shifted based on what you have seen in the first rounds of coding. [2] If you need more data collection based on these shifts, collect more data. Once you feel comfortable that you have reached saturation and know what it is you are looking at and for, you are ready for one final purposeful hike through your forest to tag (code) all your data using a pared-down set of codes.
Building Meaning, Identifying Patterns, Comparing Trees, and Seeing Forests
The final cycle of coding is also the time to generate analyses of your data. As with so much qualitative research, this is not a linear process (finish stage A and move to stage B followed by stage C). To some extent, analysis is happening all the time, even when you are in the field. Journaling, reflecting, and writing analytical memos are important in all stages of coding. But it is in the final stages of coding that you truly start to put everything together—that’s when you start understanding the nature of the forest you have been walking through. That, after all, is the point. What do all these codes of various people’s actions (fieldnotes) or people’s words (interviews) tell you about the larger phenomenon of interest? This will require mapping your codes across your data set, comparing and contrasting themes and patterns often relative to demographic factors, and overall trying to “see” the forest instead of the trees.
Different researchers employ various tools and methods to do this. Some draw pictures or concept maps, seeking to understand the connections between the themes that have emerged. Others spend time counting code frequencies or drawing elaborate outlines of codes and reworking these in search of general patterns and structure. Some even use in vivo codes to generate found poems that might provide insight into the deeper meanings and connections of the data. Mapping word clouds is a similar process. As a sociologist who is interested in issues of identity, my go-to method is to look for interactions between the codes, noting demographic elements of comparison. For example, in the very first study I conducted ( Hurst 2010a ), I used emotion codes. Specifically, I found numerous examples of sadness, anger, shame, embarrassment, pride, resentment, and fear. With the exception of pride, these are not very positive emotions. I could have stopped there, with the finding of overwhelming instances of negative emotions in the stories told by working-class college students. But I played around with these categories, clustering them by incidence and frequency and then comparing these across demographic categories (age, race, gender). I found no race or gender differences and only a hint of a difference between traditional-age college students and older students. What I did find, however, was that the emotions sorted themselves out in clusters relative to other codes. Embarrassment, shame, resentment, and fear were often found together in the same interview, along with a pattern of using “they” to refer to working-class people like the interviewees’ families. Conversely, anger, sadness, and pride were often found together, along with a pattern of using “we” to refer to working-class people. This led me to develop a theory about how working-class students manage their class identities in college, with some desirous of becoming middle class (“Renegades”) and others wanting very strongly to remain identified as working class (“Loyalists”; Hurst 2010a ).
Saldaña ( 2014 ) summarizes many of these techniques. He draws a distinction between "code mapping" and “ code landscaping .” Code mapping is a systematic and rigorous reordering of all codes into an increasingly simplified hierarchical organization. One can move from fifty or so specific stand-alone codes of various types (e.g., sadness, “I was so alone,” socializing, financial aid) and attempt to impose some meaningful order on them by clustering like phenomena with like phenomena. Perhaps sadness (an emotion code), “I was so alone” (an in vivo code), and socializing (an action code) are understood as belonging together, perhaps under a category of SOCIAL CONNECTIONS or, depending on what has emerged from your data, EXCLUSION. Code mapping is an iterative process, meaning that you can do a second or a third take of simplification and reordering. In the end, you might be left with one or two big conceptual themes or patterns.
Code landscaping “integrates textual and visual methods to see both the forest and trees” ( Saldaña 2014:285 ). Using computer-assisted word cloud mapping (WordItOut.com, wordclouds.com, wordle.net) is one way of doing this, or at least a way to jump-start the process. Word clouds quickly allow you to see what stands out in the interview or fieldnotes and can suggest relationships of importance between codes. Manually, one can also diagram the codes in terms of relationship, stressing the processual elements (what leads to what: “I felt so alone” >> sadness).
Another helpful suggestion is to chart the incidence of codes across your data set. This is particularly helpful with interview data. What (simplified) codes emerge in each interview transcript? Is there a pattern here? The two categories of Loyalist and Renegade would not have emerged had I not made these kinds of code comparisons by person interviewed. You might create a master document or spreadsheet that places each interview subject on its own row, with a brief description of that person’s story (what emerges as the focus of the interview or who they are in terms of social location, character, etc.) in a separate column and then a third column listing the key codes found in the interview. This is a good way to “see” the forest in a snapshot.
Whatever method or technique is employed, the general direction is to move from simple tags (codes) to categories to themes/concepts (figure 19.2). Eventually, those identified themes/concepts will help you build a new theory or at a minimum produce relevant theoretically informed findings, as in the second example at the end of this chapter.
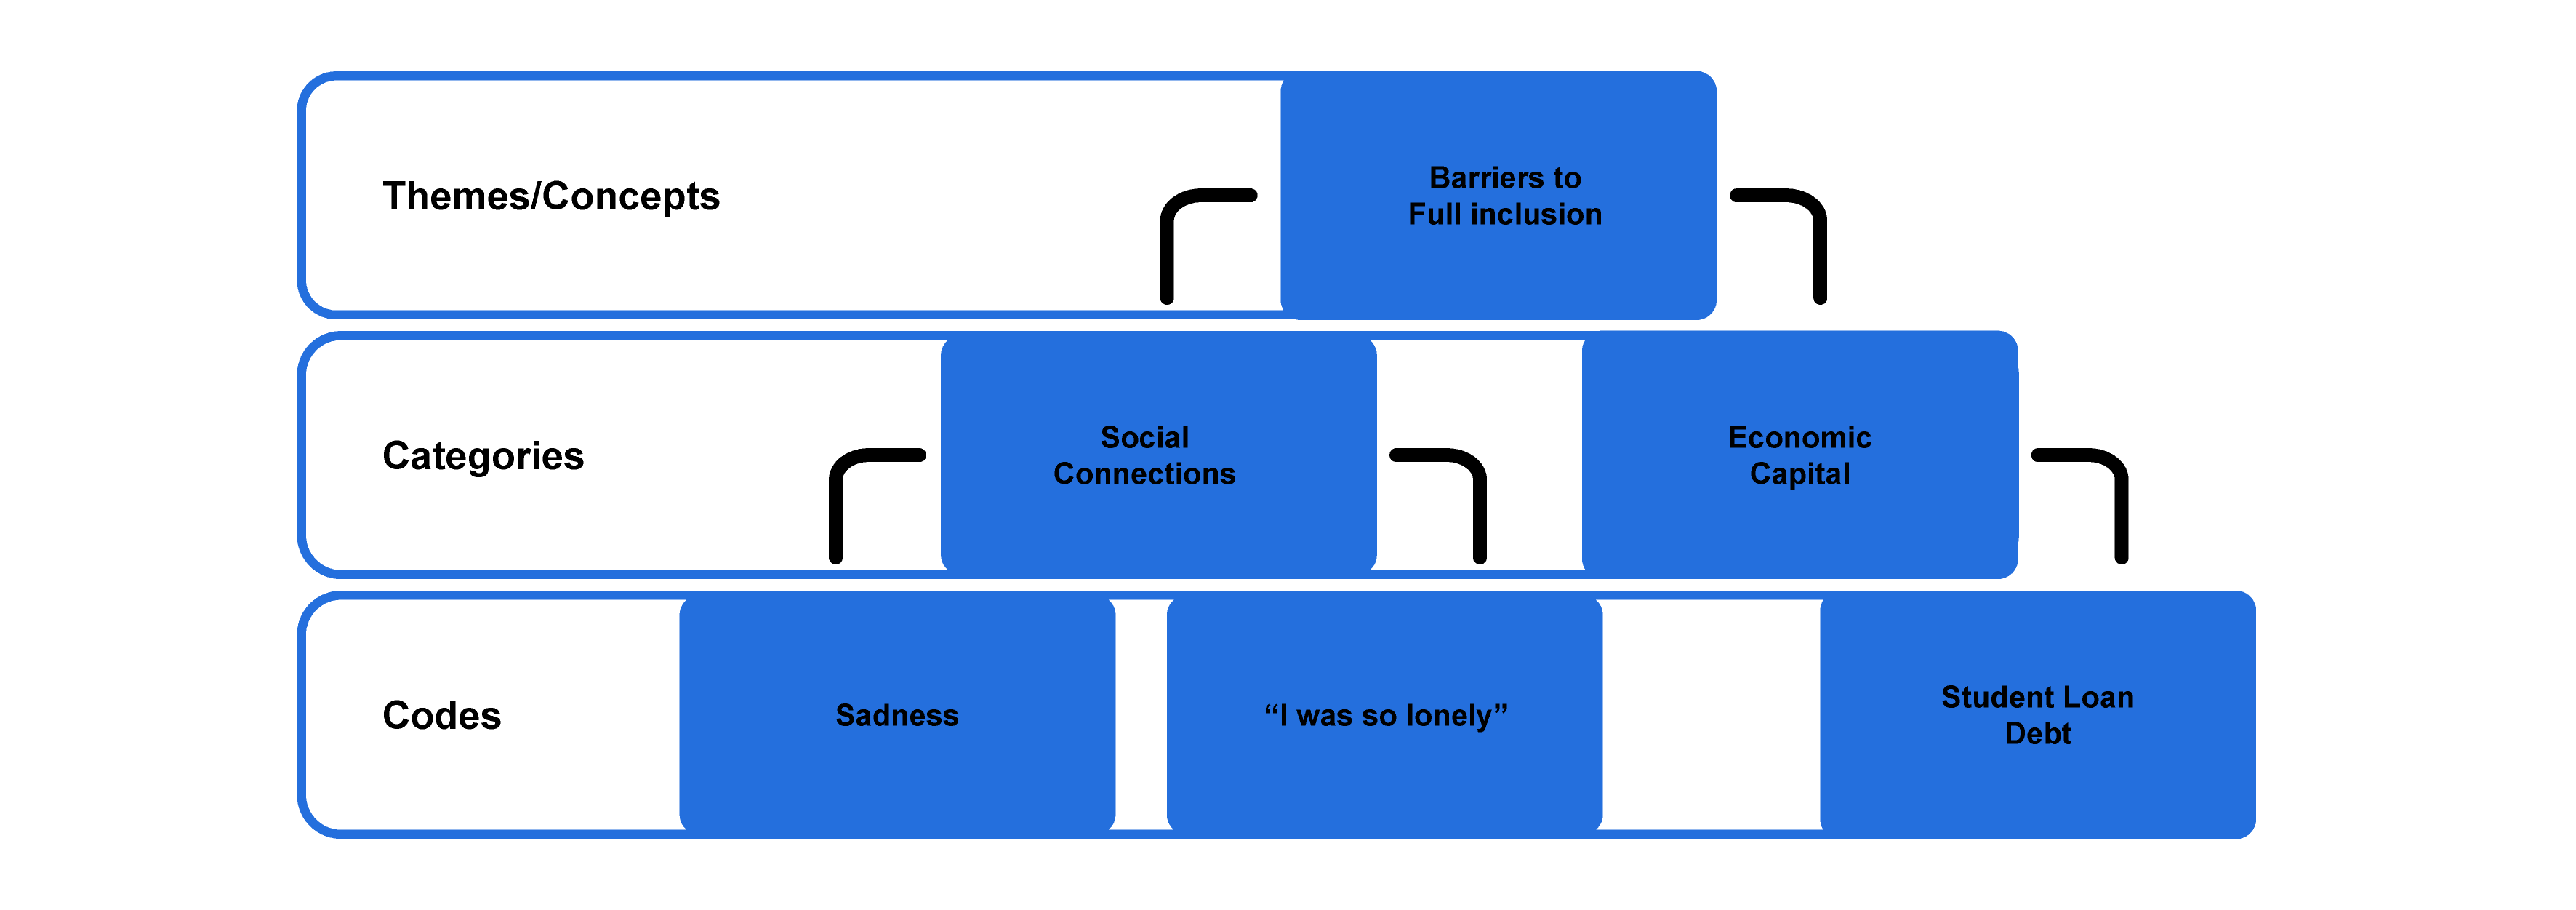
Grounded Theory has its own vocabulary when it comes to coding and data analysis, so if you are trying to do a “proper” Grounded Theory study, you might want to read up on this in more detail ( Charmaz 2014 ; Strauss 1987 ; Strauss and Corbin 2015 ). A quick summary of the approach follows. First-cycle coding employs the following kinds of codes: in vivo , process, and initial. Second-cycle coding employs focused , axial , and theoretical codes. The names of these second-cycle codes are meant to evoke the Grounded Theory approach itself: in the second cycle, the grounded theorists focus the study on axes of importance to generate theories. Focused coding pulls out the most frequent or significant codes from the first round. Axial coding reassembles data around a category, or axis. These categories or axes are meant to be concept generating: “Categories should not be so abstract as to lose their sensitizing aspect, but yet must be abstract enough to make [the emerging] theory a general guide” ( Glaser and Strauss 1967:242 ). Theoretical codes “function like umbrellas that cover and account for all other codes and categories” ( Saldaña 2014:314 ). Key words or key phrases (e.g., “Exclusion” or “Always Crying”) capture the emergent theory in the theoretical code.
Describing and Explaining the Forest: Findings and Theories
It is only now, after the laborious process of coding is complete, that you can actually move on to generate and present findings about your data. Many beginning researchers attempt to skip the middle work and get straight to writing, only to find that what they say about the data is pretty thin. The quality of qualitative research comes from the entire analytical process: open and closed coding, writing analytical memos, identifying patterns, making comparisons, and searching for order in the voluminous transcripts and fieldnotes.

But let’s say that you have followed all the steps so far. You have done multiple rounds of coding—refining, simplifying, and ordering your codes. You’ve looked for patterns. You think you have seen some master concepts emerge, and you have a good idea of what the important themes and stories are in your data. How do you begin to explain and describe those themes and stories and theories to an audience? Chapter 20 will go into further detail on how to present your work (e.g., formats, length, audience, etc.), but before we get to that, we need to talk about the stage after coding but before writing. You will want to be clear in your mind that you have the story right, that you have not missed anything of importance, and that you have searched for disconfirming evidence and not found it (if you have, you have to go back to the data and start again on a new track).
Begin with your research question(s), either as originally asked or as reformulated. What is your answer to these questions? How have your underlying goals (see chapter 4) been addressed or achieved by these answers? In other words, what is the outcome of your study? Is it about describing a culture, raising awareness of a problem, finding solutions, or delineating strategies employed by participants? Perhaps you have taken a critical approach, and your outcome is all about “giving voice” to those whose voices are often unheard. In that case, your findings will be participant driven, and your challenge will be to present passages (direct quotes) that exemplify the most salient themes found in your data. On the other hand, if you have engaged in an ethnographic study, your findings may be thick, theoretically informed descriptions of the culture under study. Your challenge there will be writing evocatively. Or to take a final example, perhaps you undertook a mixed methods study to find the best way to improve a program or policy. Your findings should be such that suggest particular recommendations. Note that in none of these cases are you presenting your codes as your findings! The coding process merely helps you find what is important to say about the case based on your research questions and underlying aims and goals.
The gold star of qualitative research presentation is the formulation of theory. Even for those not following the Grounded Theory tradition, finding something to say that goes beyond the particulars of your case is an important part of doing social science research. Remember, social science is generally not idiographic. A “theory” need not be earth shattering, as in the case of Freud’s theory of Ego, Id, and Superego. A theory is simply an explanation of something general. [3] It is a story we tell about how the world works. Theories are provisional. They can never be proven (although they can be disproven). My description of Loyalists and Renegades is a theory about how college students from the working class manage the problem of class identity when their class backgrounds no longer match their class destinations. While qualitative research is not statistically generalizable , it is and should be theoretically generalizable in this way. Loyalists and Renegades are strategies that I believe occur generally among those who are experiencing upward social mobility; they are not confined solely to the twenty-one students I interviewed in 2005 in a college in the Pacific Northwest.
What is the story your research results are telling about the world? That is the ultimate question to ask yourself as you conclude your data analysis and begin to think about writing up your results.
Further Readings
Note: Please see chapter 18 for further reading on coding generally.
Charmaz, Kathy 2014. Constructing Grounded Theory . 2nd ed. Thousand Oaks, CA: SAGE. Although this is a general textbook on conducting all stages of Grounded Theory research, a significant portion is directed at the coding process.
Strauss, Anselm. 1987. Qualitative Analysis for Social Scientists . Cambridge: Cambridge University Press. An essential reading on coding Grounded Theory for advanced students, written by one of the originators of the Grounded Theory approach. Not an easy read.
Strauss, Anselm, and Juliet Corbin. 2015. Basics of Qualitative Research: Techniques and Procedures for Developing Grounded Theory . 4th ed. Thousand Oaks, CA: SAGE. A good basic textbook for those exploring Grounded Theory. Accessible to undergraduates and graduate students
- A small aside here on social science in general and sociology in particular: It is often believed that sociologists are concerned about “people” and what people do and believe. Actually, people are our trees. We are really interested in the forest, or society. We try to understand society by listening to and observing the people who compose it. Behavioral science, in contrast, does take the individual as the object of study. ↵
- It might be helpful to read the first example of writings about qualitative data analysis in the "Further Readings" section. ↵
- Saldaña ( 2014 ) lists five essential characteristics of a social science theory: “(1) expresses a patterned relationship between two or more concepts; (2) predicts and controls action through if-then logic; (3) accounts for parameters of or variation in the empirical observations; (4) explains how and/or why something happens by stating its cause(s); and (5) provides insights and guidance for improving social life” ( 349 ). ↵
A form of first-cycle coding in which codes are developed to “investigate subjective qualities of human experience (e.g., emotions, values, conflicts, judgments) by directly acknowledging and naming those experiences” (Saldaña 2021:159). See also emotions coding and values coding .
A technique of second-cycle coding in which codes developed in the first rounds of coding are restructured into an increasingly simplified hierarchical organization, thereby allowing the general patterns and underlying structure of the field data to emerge more clearly.
A technique of second-cycle coding that “integrates textual and visual methods to see both the forest and trees" (Saldaña 2021:285).
A first-cycle coding process in which terms or phrases used by the participants become the code applied to a particular passage. It is also known as “verbatim coding,” “indigenous coding,” “natural coding,” “emic coding,” and “inductive coding,” depending on the tradition of inquiry of the researcher. It is common in Grounded Theory approaches and has even given its name to one of the primary CAQDAS programs (“NVivo”).
A later stage coding process used in Grounded Theory that pulls out the most frequent or significant codes from initial coding .
A later stage coding process used in Grounded Theory in which data is reassembled around a category, or axis.
A later stage-coding process used in Grounded Theory in which key words or key phrases capture the emergent theory.
Introduction to Qualitative Research Methods Copyright © 2023 by Allison Hurst is licensed under a Creative Commons Attribution-ShareAlike 4.0 International License , except where otherwise noted.
- Tools and Resources
- Customer Services
- Affective Science
- Biological Foundations of Psychology
- Clinical Psychology: Disorders and Therapies
- Cognitive Psychology/Neuroscience
- Developmental Psychology
- Educational/School Psychology
- Forensic Psychology
- Health Psychology
- History and Systems of Psychology
- Individual Differences
- Methods and Approaches in Psychology
- Neuropsychology
- Organizational and Institutional Psychology
- Personality
- Psychology and Other Disciplines
- Social Psychology
- Sports Psychology
- Share This Facebook LinkedIn Twitter
Article contents
General coding and analysis in qualitative research.
- Michael G. Pratt Michael G. Pratt Carroll School of Management, Boston College
- https://doi.org/10.1093/acrefore/9780190236557.013.859
- Published online: 31 January 2023
Coding and analysis are central to qualitative research, moving the researcher from study design and data collection to discovery, theorizing, and writing up the findings in some form (e.g., a journal article, report, book chapter or book). Analysis is a systematic way of approaching data for the purpose of better understanding it. In qualitative research, such understanding often involves the process of translating raw data—such as interview transcripts, observation notes, or videos—into a more abstract understanding of that data, often in the form of theory. Analytical techniques common to qualitative approaches include writing memos, narratives, cases, timelines, and figures, based on one’s data. Coding often involves using short labels to capture key elements in the data. Codes can either emerge from the data, or they can be predetermined based on extant theorizing. The type of coding one engages in depends on whether one is being inductive, deductive or abductive. Although often confounded, coding is only a part of the broader analytical process.
In many qualitative approaches, coding and analysis occur concurrently with data collection, although the type and timing of specific coding and analysis practices vary by method (e.g., ethnography versus grounded theory). These coding and analytic techniques are used to facilitate the intuitive leaps, flashes of insight, and moments of doubt and discovery necessary for theorizing. When building new theory, care should be taken to ensure that one’s coding does not do undue “violence to experience”: rather, coding should reflect the lived experiences of those one has studied.
- qualitative methods
- grounded theory
- ethnography
- inductive research
You do not currently have access to this article
Please login to access the full content.
Access to the full content requires a subscription
Printed from Oxford Research Encyclopedias, Psychology. Under the terms of the licence agreement, an individual user may print out a single article for personal use (for details see Privacy Policy and Legal Notice).
date: 06 May 2024
- Cookie Policy
- Privacy Policy
- Legal Notice
- Accessibility
- [66.249.64.20|185.80.150.64]
- 185.80.150.64
Character limit 500 /500
To read this content please select one of the options below:
Please note you do not have access to teaching notes, coding qualitative data: a synthesis guiding the novice.
Qualitative Research Journal
ISSN : 1443-9883
Article publication date: 8 May 2019
Issue publication date: 4 June 2019
Qualitative research has gained in importance in the social sciences. General knowledge about qualitative data analysis, how to code qualitative data and decisions concerning related research design in the analytical process are all important for novice researchers. The purpose of this paper is to offer researchers who are new to qualitative research a thorough yet practical introduction to the vocabulary and craft of coding.
Design/methodology/approach
Having pooled, their experience in coding qualitative material and teaching students how to code, in this paper, the authors synthesize the extensive literature on coding in the form of a hands-on review.
The aim of this paper is to provide a thorough yet practical presentation of the vocabulary and craft of coding. The authors, thus, discuss the central choices that have to be made before, during and after coding, providing support for novices in practicing careful and enlightening coding work, and joining in the debate on practices and quality in qualitative research.
Originality/value
While much material on coding exists, it tends to be either too comprehensive or too superficial to be practically useful for the novice researcher. This paper, thus, focusses on the central decisions that need to be made when engaging in qualitative data coding in order to help researchers new to qualitative research engage in thorough coding in order to enhance the quality of their analyses and findings, as well as improve quantitative researchers’ understanding of qualitative coding.
- Transparency
- Qualitative data
- Qualitative data analysis
Skjott Linneberg, M. and Korsgaard, S. (2019), "Coding qualitative data: a synthesis guiding the novice", Qualitative Research Journal , Vol. 19 No. 3, pp. 259-270. https://doi.org/10.1108/QRJ-12-2018-0012
Emerald Publishing Limited
Copyright © 2019, Emerald Publishing Limited
Related articles
We’re listening — tell us what you think, something didn’t work….
Report bugs here
All feedback is valuable
Please share your general feedback
Join us on our journey
Platform update page.
Visit emeraldpublishing.com/platformupdate to discover the latest news and updates
Questions & More Information
Answers to the most commonly asked questions here

Guide to Thematic Analysis

- Abductive Thematic Analysis
- Collaborative Thematic Analysis
- Deductive Thematic Analysis
- How to Do Thematic Analysis
- Inductive Thematic Analysis
- Reflexive Thematic Analysis
- Advantages of Thematic Analysis
- Thematic Analysis for Case Studies
- Introduction
What is the purpose of coding in thematic analysis?
What should a codebook include, how should i code data for a thematic analysis, how do you organize codes in a thematic analysis.
- Disadvantages of Thematic Analysis
- Thematic Analysis in Educational Research
- Thematic Analysis Examples
- Thematic Analysis for Focus Groups
- Thematic Analysis vs. Grounded Theory
- What is Thematic Analysis?
- Increasing Rigor in Thematic Analysis
- Thematic Analysis for Interviews
- Thematic Analysis Literature Review
- Thematic Analysis in Mixed Methods Approach
- Thematic Analysis in Observations
- Peer Review in Thematic Analysis
- How to Present Thematic Analysis Results
- Thematic Analysis in Psychology
- Thematic Analysis of Secondary Data
- Thematic Analysis in Social Work
- Thematic Analysis Software
- Thematic Analysis in Surveys
- Thematic Analysis in UX Research
- Thematic vs. Content Analysis
- Thematic Analysis vs. Discourse Analysis
- Thematic Analysis vs. Framework Analysis
- Thematic Analysis vs. Narrative Analysis
- Thematic Analysis vs. Phenomenology
Thematic Coding
Thematic analysis is a qualitative research method widely used across various disciplines to identify, analyze, and report patterns within data . It plays a crucial role in providing a detailed and complex account of data. Similar to many other qualitative research methods like framework analysis , narrative analysis , and discourse analysis , the process of coding is fundamental to thematic analysis, serving as the bridge between raw data and the emergence of insightful themes.
This article will guide you through the essential steps of coding for thematic analysis, from understanding the purpose of coding to organizing codes efficiently. By offering a clear and concise overview of the coding process, we aim to equip qualitative researchers with the necessary tools for conducting their thematic analysis effectively.

Coding in thematic analysis serves several critical functions. First, it allows researchers to systematically sift through vast amounts of qualitative data —such as interview transcripts , observations , or written responses—to identify significant patterns or themes. By breaking down the data into manageable segments, coding transforms raw information into organized categories that are easier to analyze.
Second, coding facilitates the recognition of relationships between different data segments. As researchers assign codes to data, they might begin to notice connections, contrasts, and trends that were not apparent at first glance. This process is crucial for developing a deeper understanding of the data and for the subsequent identification of themes that capture the studied phenomenon.
Furthermore, coding facilitates the rigor and transparency of the analysis. A well-documented coding process allows other researchers to understand the steps taken to arrive at certain conclusions, thereby enhancing the credibility and rigor of the study. Coding is a methodical approach to qualitative analysis , providing a clear trail from the raw data to the final report.
Lastly, coding is not just about data reduction; it's also an interpretative act. Researchers engage with the data, applying their theoretical knowledge and analytical skills to discern subtle nuances and meanings. This interpretive aspect of coding is what allows thematic analysis to go beyond mere description to provide insightful interpretations of complex human experiences and social phenomena.

When it comes to a codebook , thematic analysis requires a set of elements to facilitate coding qualitative data . It encapsulates not only the definitions of each code but also integrates rules for application, examples, and provisions for theme development, making it an indispensable tool for researchers. Crafting a codebook is an iterative part of coding, setting a structured path for qualitative data analysis and ensuring a uniform approach across the data set.
Central to the codebook are the definitions of the codes themselves. These are crafted with precision, providing researchers with clear guidance on when and how to apply each code to the data. This clarity is crucial for enhancing consistency in the data analysis process, thereby enhancing the overall trustworthiness and quality of the research findings.
Alongside these definitions, the codebook delineates specific rules for coding. These rules address potential challenges in coding, such as handling ambiguous data, coding data that might fit into multiple categories, and distinguishing between codes that are similar in nature.
Equally important are the examples included for each code. By illustrating how codes are applied to actual pieces of data, these examples serve as practical guides that clarify the definitions and rules, ensuring that researchers can apply the codes accurately and consistently.
As the analysis evolves, the codebook itself is designed to accommodate the emergence and definition of themes. This includes grouping codes under broader thematic categories and providing preliminary definitions and examples for these themes, thereby facilitating a deeper and more organized analysis of the data.
The dynamic nature of thematic analysis necessitates that the codebook also includes a section for revision history. This part of the document tracks the evolution of the codebook, documenting any changes or updates made throughout the analysis. This not only provides transparency but also aids in understanding the development and refinement of the coding scheme over time.
Furthermore, additional notes may be included to cover any other pertinent information that does not fit neatly into the aforementioned categories but is nevertheless crucial for the coding process. This could encompass reflections on the coding strategy, details about the coding environment, or the thematic analysis software tools utilized, offering valuable insights for the ongoing analysis or for other researchers who might use the codebook as a reference.

Turn your research question into valuable insights with ATLAS.ti
Organize, code, and analyze your data with our powerful analysis platform. Start with a free trial today.
Coding data in a thematic analysis process involves systematically identifying and labeling relevant parts of the data. This process is not just about tagging data with codes but also about engaging deeply with the content to discern underlying patterns and meanings. Coding lays the groundwork for the subsequent organization of codes and the generation of themes. It requires a meticulous and iterative approach, where data is reviewed multiple times to ensure that codes are accurately and comprehensively applied.
Below, we outline three key phases of the analysis process in thematic analysis: coding data, identifying patterns across data, and interpreting patterns across data.
Coding data
Coding the data refers to the process of reading through the data set (e.g., interview transcripts , field notes , documents , social media posts , etc.) to identify interesting excerpts and assigning codes that capture the essence of each data segment relevant to the research questions or objectives. At this stage, the aim is to code qualitative data as broadly and inclusively as possible, without worrying about the specificity or the potential overlap between different codes.
Coders should approach the data with an open mind, allowing the data itself to guide the creation of new codes. Codes can also emerge from more latent meanings present in the data, such that researchers can draw on their conceptual or theoretical understanding to create codes. This phase is exploratory in nature, with the goal of creating codes that capture the richness and diversity of the data.
Identifying patterns across data
After the expansive coding of the data, researchers can work with these codes to identify themes or patterns. This often also involves refining the codes and beginning to narrow down which are the most appropriate codes for the research questions or objectives. This phase requires the coder to make decisions about which codes to keep, combine, or discard.
The researcher can begin to identify patterns as they revise their codes: while a code might capture one idea, a theme brings together multiple ideas around a central organizing concept. At this stage, researchers begin creating provisional themes which will continue to be refined as the researcher progresses through their interpretive analysis.

Interpreting patterns across data
After engaging deeply with thematic coding and pattern identification, researchers can full develop their analysis by interpreting or making sense of the emerging patterns. It is important to revisit the data excerpts captured within each theme to ensure the theme effectively portrays the central organizing concept within the supporting data. This is also the point at which researchers name and define their themes, which can involve revising, combining, or even discarding themes; the objective is to have a set of themes that that tell a coherent and meaningful story about the data.
The researcher's subjective experience plays an important role in interpreting patterns as well, and researchers can critically reflect on how and why they make their interpretations. Fleshing out the interpretation of patterns and themes also relies heavily on writing up the analysis, as putting one's thoughts into words often clarifies new insights, exposes inconsistencies, and can effectively bridge key findings and supporting data.

Organizing codes is a critical step in thematic coding. It involves sorting, grouping, and categorizing codes into meaningful clusters that facilitate researchers' interpretation and development of themes.
This is where the researcher begins to see beyond individual data points and starts to understand the broader patterns and relationships within the data. It requires a thoughtful and iterative approach, constantly refining the organization of codes to ensure that they represent the data and align with the research objectives.
Here, we explore three essential strategies for organizing codes in thematic analysis: creating thematic maps, using code hierarchies, and iterative re-coding.
Creating thematic maps
Thematic maps are visual representations that illustrate the relationships between codes and potential themes. They help researchers move from a collection of codes to a structured understanding of how these codes interconnect and form broader themes. Creating a thematic map involves arranging codes based on their conceptual similarities and identifying the overarching themes to which they contribute. This visual tool is particularly useful for seeing how individual codes can combine to form a coherent narrative within the data. It also aids in identifying any gaps or overlaps in the coding.
Using code hierarchies
Code hierarchies involve organizing codes into a structured format, where broader categories encompass a set of related sub-codes. This approach helps in managing the complexity of the data by breaking down broad themes into more specific, manageable elements. Hierarchies can clarify the relationships between codes, indicating which are central themes and which are supporting or subsidiary. By establishing a hierarchical structure, researchers can more easily navigate their codes and refine their analysis, ensuring that each code is placed within a meaningful context.
Iterative re-coding
Organizing codes is not a one-off task but an iterative process that evolves as the analysis deepens. Iterative re-coding involves revisiting and potentially re-organizing the codes multiple times throughout the analysis. This may include merging similar codes, splitting broad codes into more specific ones, or discarding codes that no longer seem relevant. Each round of re-coding refines the organization of codes, making the eventual themes more robust and grounded in the data. This process ensures that the final themes reflect the complexities and richness of the data, contributing to a more nuanced and insightful qualitative research analysis.

Make ATLAS.ti your thematic analysis software solution
ATLAS.ti is the ideal qualitative data analysis software for qualitative coding. See why with a free trial.
Cookie consent
We use our own and third-party cookies to show you more relevant content based on your browsing and navigation history. Please accept or manage your cookie settings below. Here's our cookie policy

- Form Builder Signups and orders
- Survey maker Research and feedback
- Quiz Maker Trivia and product match
- Find Customers Generate more leads
- Get Feedback Discover ways to improve
- Do research Uncover trends and ideas
- Marketers Forms for marketing teams
- Product Forms for product teams
- HR Forms for HR teams
- Customer success Forms for customer success teams
- Business Forms for general business
- Form templates
- Survey templates
- Quiz templates
- Poll templates
- Order forms
- Feedback forms
- Satisfaction surveys
- Application forms
- Feedback surveys
- Evaluation forms
- Request forms
- Signup forms
- Business surveys
- Marketing surveys
- Report forms
- Customer feedback form
- Registration form
- Branding questionnaire
- 360 feedback
- Lead generation
- Contact form
- Signup sheet
- Help center Find quick answers
- Contact us Speak to someone
- Our blog Get inspired
- Our community Share and learn
- Our guides Tips and how-to
- Updates News and announcements
- Brand Our guidelines
- Partners Browse or join
- Careers Join our team
- → The 6-Step Guide to Market Research P...
The 6-Step Guide to Market Research Processes
Looking for a step-by-step guide to market research processes? Learn more about the marketing research process and methods to gather data—and make the most of it.

Latest posts on Tips
Typeform | 05.2024
Typeform | 04.2024
Say what you will about McDonald’s, but one of the things most respected about their brand is the international menu concept.
From maple and bacon poutine in Canada and gazpacho in Spain to India’s McPaneer Royale, McDonald’s knows how to give the people what they want.
And how do they inject local appeal in a global brand? By gaining a deep understanding of the consumers in every target market they plan to enter.
If you’re thinking about doing consumer insights research, you should be familiar with market research processes. Let’s start with the basics. What is market research, and how is it different from marketing research?
What is market research?
People often confuse market research and marketing research. Aren’t they just different words for the same thing?
ESOMAR, the global research and data association, and the American Marketing Association would disagree. Here’s the gist:
Market research emphasizes the process of collecting consumer data , while marketing research refers to the product of that information and/or a function within an organization.
Essentially, you might be looking for a marketing researcher to conduct market research. Market research will help you answer questions about your customers, your competitors, or current and potential markets.
The 6-step marketing research process

Market research can seem like a mystery.
However, market research processes are quite systematic—well, in theory. In practice, the steps involve exploration, creativity, and abstraction.
Here are a few steps you can follow to make it a bit easier.
1. Identify the problem
Researchers are curious people. That’s why every research project starts with a question.
What is the part of your business you want to know more about? Identifying the problem is the most important step in market research processes. It’s going to determine every step you take in the future—of market research, anyway.
Not sure where to start? Here are a few tips:
Look for marketing challenges or opportunities. Maybe your brand awareness could use a boost. You've noticed declining customer loyalty, or you’re considering opportunities in emerging markets.
Frame it as a question. Why is customer loyalty decreasing? How can we enter the market for luxury hotels? What does our customer’s typical path to purchase look like?
Determine what type of problem you have. In market research, a problem can be ambiguous, clearly defined, or somewhere in the middle. Do you know the variables and factors influencing what you want to measure? This is important as it'll influence your overall research design, which is up next.
2. Design the research
There are three types of research designs. The design you choose will be informed by how well-defined your problem is.
If you don’t know much about the problem, you need:
Exploratory research: If you don’t know the major variables or factors at play, your research is ambiguous. Exploratory research can help you develop a hypothesis or ask a more precise question. If you have a vague idea about what’s important to solve the problem, you need:
Descriptive research: Descriptive research does what it says on the box— it describes a certain phenomenon or the characteristics of a population. It can build on exploratory research but doesn’t give insight into the how, when, or why. Descriptive research is useful for parsing out market segments and measuring performance. Consequently, you need a pretty good idea of what you’re measuring and how it'll be measured. If you want to know how cause and effect are linked, you need:
Causal research: Market researchers conduct causal research when they want to understand the relationships between two or more variables. Simply put, causal research helps you understand cause and effect.
3. Choose your sample and market research methods
Data is the essence of market research. At the end of these market research processes, data is analyzed, interpreted, and turned into information and actionable insights.
Data can be qualitative or quantitative . Qualitative data can take many forms, from descriptions to audio and video. Quantitative data is typically presented in values and figures.
When choosing your sample, you must select the population you want to study. A population is a group with some shared characteristics that you’re interested in gathering data from. It can be broad (Canadians) or narrow (independent gym owners in Chicago).
No matter how small or large your population, you’ll unlikely be able to work with everyone.
The key to choosing a good sample is that it is representative. That means the people you select to participate (the sample) should reflect the larger group you’re studying.
4. Get the data
There are two forms of data you can collect: primary and secondary data.
Primary data is gathered specifically for your project. Secondary data has already been collected, either internally or externally through government agencies, consulting or market research firms, websites, social networks, and so on.
Depending on your research design, you may want to check internally for secondary data. For example, let’s say you’re trying to understand the annual purchase cycle for your business. You'd gather sales and reports and company records—that's secondary data.
But of course, secondary data still needs to be prepared for analysis
There are two ways to collect primary data: directly or indirectly. Direct data collection is just that—you are speaking to your participants directly. That can be through surveys, interviews, focus groups, and so on. Indirect data collection typically means observation. Think in-store observation, shelf experiments, or website heatmaps.
5. Analyze the data
Data analysis is a process of looking for patterns in data and trying to understand why those patterns exist. Data can be analyzed quantitatively or qualitatively.
Quantitative data analysis is a process more complicated than can be described here. Unless you’re a math whiz, you’ll probably just use a data analysis software like SPSS or StatCrunch.
Qualitative data analysis typically involves coding—but not the computer programming kind, don’t you worry. This type of coding can be done by hand or using software such as NVivo. It involves looking for themes, concepts, and words that are repeated throughout the data.
6. Interpret and present the insights
Interpretation involves answering the question: What does the data tell me about what I wanted to know?
That’s where themes and patterns come in. You can describe trends and present them using figures or descriptions drawn from your participants.
Part of interpretation is using what you know about customers, businesses, or markets to provide recommendations for how to move forward. These data-driven suggestions should offer a solution to the initial problem. The results of the research can also bring to light a problem you weren’t even aware you had.
Overview of market research methods

Market researchers are able to draw on a large toolbox of market research methods. Typically, they fall into the qualitative or quantitative category because of the type of data they produce.
Focus groups
Best for: Exploratory research
Type of method: Qualitative
A market research technique that involves a group discussion about certain topics led by a moderator to uncover the thoughts and opinions of participants.
In-depth interviews
Best for: Descriptive research
An interview that's conducted with an individual aimed at getting deeper insights about attitudes, motivations, or experiences.
Ethnography
Best for: Descriptive research
Also known as participant observation, it involves spending time with participants in their natural environment (as opposed to a lab setting).
Observational
Carefully watch people to understand what they’re doing. It allows you to learn about consumer or employee behavior but not the motivation behind it.
Discourse analysis
Best for: Exploratory or descriptive research
This is a fancy way of saying “analyzing what people say.” Social listening is a form of discourse analysis. Examining customer reviews, help transcripts, social media comments, and more are all forms of discourse analysis.
Type of method: Quantitative
Surveys are the crux of market research. They involve collecting facts, figures, and opinions using a questionnaire. Surveys can also yield qualitative data if participants write out answers. Surveys may seem simple, but there are a lot of factors that can turn good intentions into bad data—be sure to read our tips on the right question types to ask .
Structured observation
Observation research can also be quantitative if you are observing participants without direct involvement and assigning values to certain behaviors.
A/B testing
Also called split testing, this is a way to compare responses to a variation of a single variable to see which performs better. For example, presenting users with two versions of an ad to see which gets more clicks.
Best for: Causal research
Marketing experimentation typically involves manipulating a variable to see how it influences behavior. It can be conducted in a lab or in the field.
Examples of market research

Time to put this into practice. Let’s look at market research examples of various types of research designs.
Exploratory market research
Mobile phone company HTC wanted to understand how they could improve the user experience of their phones. This problem required exploratory research because there wasn’t a specific feature they wanted to test. They simply wanted to learn more from their customers.
With market research, they observed how participants interacted with their phones. They looked for challenges people had with everyday usage. After analyzing these pain points, they added new functions to their next model that made the phones easier to use.
Descriptive market research
Company ABC wants to understand how large the market for vegan cheese is in Canada. They have a somewhat defined research problem: What is the potential market share for vegan cheese?
In order to provide an answer, market researchers will have to describe various characteristics: who the customers are, why they buy vegan cheese, competitor market penetration, and potential opportunities.
This requires mixed-method research. The researchers might collect secondary data on the number of vegans in Canada or how much vegan cheese is sold in the country and through which companies. They may also conduct focus groups to understand what motivates people to buy vegan cheese.
Once complete, they'll be able to present statistics on vegans in Canada and estimate Company ABC’s potential market share.
Causal market research
Causal research requires keeping variables and conditions the same, save for the one you are testing. German marketing and sensory research company iSi is a company that runs both field and lab experiments.
They worked with a chocolate bar company to design an experiment that tested 12 different chocolate bar recipes.
The consumers sequentially tested the recipes and provided ratings (quantitative data) and descriptions (qualitative data) of each one. The result was that consumers were most satiated by “a firm, tough texture and a higher amount of caramel and peanuts.”
Discovering market research processes
One thing to remember is that market research is an iterative process. You can keep using what you learn to conduct better studies and evaluate the changing market conditions and the whims of consumers.
Ready to tackle the market research process? Build a market research survey with Typeform—choose from one of our customizable templates to gather beautifully designed data.

About the author
We're Typeform - a team on a mission to transform data collection by bringing you refreshingly different forms.
Liked that? Check these out:

Make your next market research survey count with these 9 tips
Learn how to get meaningful feedback and strengthen existing customer relationships.
Paul Campillo | 04.2016

51 brand awareness survey questions + best practices
Supercharge your brand awareness surveys with these best practices and question ideas.
Lydia Kentowski | 01.2024
IMAGES
VIDEO
COMMENTS
Wide range of Qualitative Coding Tools: In Vivo Coding, Creative Coding, Open Coding, etc. Code your Qualitative Data with MAXQDA - Powerful & Easy-to-use Research Software
Step 1 - Initial coding. The first step of the coding process is to identify the essence of the text and code it accordingly. While there are various qualitative analysis software packages available, you can just as easily code textual data using Microsoft Word's "comments" feature.
Coding is a qualitative data analysis strategy in which some aspect of the data is assigned a descriptive label that allows the researcher to identify related content across the data. How you decide to code - or whether to code- your data should be driven by your methodology. But there are rarely step-by-step descriptions, and you'll have to ...
Qualitative research is often evaluated on the strength of its presentation. Some traditions of qualitative inquiry, such as deep ethnography, depend on written thick descriptions, without which the research is wholly incomplete, even nonexistent. ... As with qualitative data analysis generally, coding is often done recursively, meaning that ...
Qualitative content analysis is a research method for systematically identifying, coding, and analyzing patterns of meaning in qualitative data. Qualitative data can be collected from a variety of sources, such as interviews, focus groups, documents, and social media posts.
The primary goal of coding qualitative data is to change data into a consistent format in support of research and reporting. A code can be a phrase or a word that depicts an idea or recurring theme in the data. The code's label must be intuitive and encapsulate the essence of the researcher's observations or participants' responses.
Coding is the process of labeling and organizing your qualitative data to identify different themes and the relationships between them. When coding customer feedback, you assign labels to words or phrases that represent important (and recurring) themes in each response. These labels can be words, phrases, or numbers; we recommend using words or ...
Organization of Coding Scheme Whether deductive or inductive, codes are organized into a coding scheme that you then use to systematically identify relevant segments of data within your entire data set. Flat Coding Codes are organized at the same conceptual level. Hierarchical Coding Codes are organized into groups and subgroups
This chapter provides an overview of selected qualitative data analytic strategies with a particular focus on codes and coding. Preparatory strategies for a qualitative research study and data management are first outlined. Six coding methods are then profiled using comparable interview data: process coding, in vivo coding, descriptive coding ...
Coding qualitative data. Qualitative coding is almost always a necessary part of the qualitative data analysis process. Coding provides a way to make the meaning of the data clear to you and to your research audience. What is a code? A code in the context of qualitative data analysis is a summary of a larger segment of text.
Simply put, coding is qualitative analysis. Coding is the analytical phase where researchers become immersed in their data, take the time to fully get to know it (Basit, 2003; Elliott, 2018), and allow its sense to be discerned.A code is "…a word or short phrase that symbolically assigns a summative, salient, essence-capturing, and/or evocative attribute for a portion of language-based or ...
Qualitative data coding is the process of assigning quantitative tags to the pieces of data. This is necessary for any type of large-scale analysis because you 1) need to have a consistent way to compare and contrast each piece of qualitative data, and 2) will be able to use tools like Excel and Google Sheets to manipulate quantitative data ...
This coding manual is the best go-to text for qualitative data analysis, both for a manual approach and for computer-assisted analysis. It offers a range of coding strategies applicable to any research projects, written in accessible language, making this text highly practical as well as theoretically comprehensive.
What is Coding? •Coding •Process to assess and assign interpretation of data •"Coding is not a precise science; it is primarily an interpretive act" (Saldaña, 2016, p. 5) •Codes •Words or phrases that are a summative attribute for data (Tracy, 2013) •Researcher-generated translation of data •Interpreted meaning •Codifying
that can help pave the way to the researcher's interpretive judgements and improve the ir quality. By using this paper, novice researchers will be able to reflect more carefully on the ...
Qualitative data coding (analysis) is the process of systematically transforming qualitative data into meaningful outcomes that represent the data and answer the research question(s ; Adu, 2019a).
Figure 19.2. Qualitative Data Analysis Model, From Codes to Concepts. Grounded Theory has its own vocabulary when it comes to coding and data analysis, so if you are trying to do a "proper" Grounded Theory study, you might want to read up on this in more detail (Charmaz 2014; Strauss 1987; Strauss and Corbin 2015). A quick summary of the ...
Subscribe. Coding and analysis are central to qualitative research, moving the researcher from study design and data collection to discovery, theorizing, and writing up the findings in some form (e.g., a journal article, report, book chapter or book). Analysis is a systematic way of approaching data for the purpose of better understanding it.
We shift the transparency debate from ethnography and interviews to how transparency operates in the content analysis, or coding, of documents and argue that scholars should create a living codebook to analyze their data. The living codebook is a set of tools that makes the analysis of documents more transparent among team members and, if researchers decide to make it public, to the scholarly ...
Page 3 of 22 Analyzing Qualitative Data: 4 Thematic coding and categorizing Sage Research Methods This form of retrieval is a very useful way of managing or organizing the data, and enables the researcher to examine the data in a structured way. 4. You can use the list of codes, especially when developed into a hierarchy, to
While much material on coding exists, it tends to be either too comprehensive or too superficial to be practically useful for the novice researcher. This paper, thus, focusses on the central decisions that need to be made when engaging in qualitative data coding in order to help researchers new to qualitative research engage in thorough coding ...
and for all. Keywords: Coding, Qualitative Data Analysis, CAQDAS . Coding is an almost universal process in qualitative research; it is a fundamental aspect of the analytical process and the ways in which researchers break down their data to make something new." Coding is the process of analyzing qualitative text data by taking them apart
Coding by Qualitative Design. Several types of qualitative approaches/designs. Ethnography, Phenomenology, Grounded Theory, Narrative Research, Case Study, Qualitative Descriptive. We will go through an example "chunk" of data, and code it together as if it were a Grounded Theory study.
For many researchers unfamiliar with qualitative research, determining how to conduct qualitative analyses is often quite challenging. Part of this challenge is due to the seemingly limitless approaches that a qualitative researcher might leverage, as well as simply learning to think like a qualitative researcher when analyzing data. From framework analysis (Ritchie & Spencer, 1994) to content ...
Thematic Coding. Thematic analysis is a qualitative research method widely used across various disciplines to identify, analyze, and report patterns within data.It plays a crucial role in providing a detailed and complex account of data. Similar to many other qualitative research methods like framework analysis, narrative analysis, and discourse analysis, the process of coding is fundamental ...
Ensuring coding consistency across a research team is a significant challenge. Without uniform standards, the reliability of your data can suffer.
Qualitative data analysis typically involves coding—but not the computer programming kind, don't you worry. This type of coding can be done by hand or using software such as NVivo. It involves looking for themes, concepts, and words that are repeated throughout the data.