- Privacy Policy
Home » Questionnaire – Definition, Types, and Examples

Questionnaire – Definition, Types, and Examples
Table of Contents

Questionnaire
Definition:
A Questionnaire is a research tool or survey instrument that consists of a set of questions or prompts designed to gather information from individuals or groups of people.
It is a standardized way of collecting data from a large number of people by asking them a series of questions related to a specific topic or research objective. The questions may be open-ended or closed-ended, and the responses can be quantitative or qualitative. Questionnaires are widely used in research, marketing, social sciences, healthcare, and many other fields to collect data and insights from a target population.
History of Questionnaire
The history of questionnaires can be traced back to the ancient Greeks, who used questionnaires as a means of assessing public opinion. However, the modern history of questionnaires began in the late 19th century with the rise of social surveys.
The first social survey was conducted in the United States in 1874 by Francis A. Walker, who used a questionnaire to collect data on labor conditions. In the early 20th century, questionnaires became a popular tool for conducting social research, particularly in the fields of sociology and psychology.
One of the most influential figures in the development of the questionnaire was the psychologist Raymond Cattell, who in the 1940s and 1950s developed the personality questionnaire, a standardized instrument for measuring personality traits. Cattell’s work helped establish the questionnaire as a key tool in personality research.
In the 1960s and 1970s, the use of questionnaires expanded into other fields, including market research, public opinion polling, and health surveys. With the rise of computer technology, questionnaires became easier and more cost-effective to administer, leading to their widespread use in research and business settings.
Today, questionnaires are used in a wide range of settings, including academic research, business, healthcare, and government. They continue to evolve as a research tool, with advances in computer technology and data analysis techniques making it easier to collect and analyze data from large numbers of participants.
Types of Questionnaire
Types of Questionnaires are as follows:
Structured Questionnaire
This type of questionnaire has a fixed format with predetermined questions that the respondent must answer. The questions are usually closed-ended, which means that the respondent must select a response from a list of options.
Unstructured Questionnaire
An unstructured questionnaire does not have a fixed format or predetermined questions. Instead, the interviewer or researcher can ask open-ended questions to the respondent and let them provide their own answers.
Open-ended Questionnaire
An open-ended questionnaire allows the respondent to answer the question in their own words, without any pre-determined response options. The questions usually start with phrases like “how,” “why,” or “what,” and encourage the respondent to provide more detailed and personalized answers.
Close-ended Questionnaire
In a closed-ended questionnaire, the respondent is given a set of predetermined response options to choose from. This type of questionnaire is easier to analyze and summarize, but may not provide as much insight into the respondent’s opinions or attitudes.
Mixed Questionnaire
A mixed questionnaire is a combination of open-ended and closed-ended questions. This type of questionnaire allows for more flexibility in terms of the questions that can be asked, and can provide both quantitative and qualitative data.
Pictorial Questionnaire:
In a pictorial questionnaire, instead of using words to ask questions, the questions are presented in the form of pictures, diagrams or images. This can be particularly useful for respondents who have low literacy skills, or for situations where language barriers exist. Pictorial questionnaires can also be useful in cross-cultural research where respondents may come from different language backgrounds.
Types of Questions in Questionnaire
The types of Questions in Questionnaire are as follows:
Multiple Choice Questions
These questions have several options for participants to choose from. They are useful for getting quantitative data and can be used to collect demographic information.
- a. Red b . Blue c. Green d . Yellow
Rating Scale Questions
These questions ask participants to rate something on a scale (e.g. from 1 to 10). They are useful for measuring attitudes and opinions.
- On a scale of 1 to 10, how likely are you to recommend this product to a friend?
Open-Ended Questions
These questions allow participants to answer in their own words and provide more in-depth and detailed responses. They are useful for getting qualitative data.
- What do you think are the biggest challenges facing your community?
Likert Scale Questions
These questions ask participants to rate how much they agree or disagree with a statement. They are useful for measuring attitudes and opinions.
How strongly do you agree or disagree with the following statement:
“I enjoy exercising regularly.”
- a . Strongly Agree
- c . Neither Agree nor Disagree
- d . Disagree
- e . Strongly Disagree
Demographic Questions
These questions ask about the participant’s personal information such as age, gender, ethnicity, education level, etc. They are useful for segmenting the data and analyzing results by demographic groups.
- What is your age?
Yes/No Questions
These questions only have two options: Yes or No. They are useful for getting simple, straightforward answers to a specific question.
Have you ever traveled outside of your home country?
Ranking Questions
These questions ask participants to rank several items in order of preference or importance. They are useful for measuring priorities or preferences.
Please rank the following factors in order of importance when choosing a restaurant:
- a. Quality of Food
- c. Ambiance
- d. Location
Matrix Questions
These questions present a matrix or grid of options that participants can choose from. They are useful for getting data on multiple variables at once.
| The product is easy to use | ||||
| The product meets my needs | ||||
| The product is affordable |
Dichotomous Questions
These questions present two options that are opposite or contradictory. They are useful for measuring binary or polarized attitudes.
Do you support the death penalty?
How to Make a Questionnaire
Step-by-Step Guide for Making a Questionnaire:
- Define your research objectives: Before you start creating questions, you need to define the purpose of your questionnaire and what you hope to achieve from the data you collect.
- Choose the appropriate question types: Based on your research objectives, choose the appropriate question types to collect the data you need. Refer to the types of questions mentioned earlier for guidance.
- Develop questions: Develop clear and concise questions that are easy for participants to understand. Avoid leading or biased questions that might influence the responses.
- Organize questions: Organize questions in a logical and coherent order, starting with demographic questions followed by general questions, and ending with specific or sensitive questions.
- Pilot the questionnaire : Test your questionnaire on a small group of participants to identify any flaws or issues with the questions or the format.
- Refine the questionnaire : Based on feedback from the pilot, refine and revise the questionnaire as necessary to ensure that it is valid and reliable.
- Distribute the questionnaire: Distribute the questionnaire to your target audience using a method that is appropriate for your research objectives, such as online surveys, email, or paper surveys.
- Collect and analyze data: Collect the completed questionnaires and analyze the data using appropriate statistical methods. Draw conclusions from the data and use them to inform decision-making or further research.
- Report findings: Present your findings in a clear and concise report, including a summary of the research objectives, methodology, key findings, and recommendations.
Questionnaire Administration Modes
There are several modes of questionnaire administration. The choice of mode depends on the research objectives, sample size, and available resources. Some common modes of administration include:
- Self-administered paper questionnaires: Participants complete the questionnaire on paper, either in person or by mail. This mode is relatively low cost and easy to administer, but it may result in lower response rates and greater potential for errors in data entry.
- Online questionnaires: Participants complete the questionnaire on a website or through email. This mode is convenient for both researchers and participants, as it allows for fast and easy data collection. However, it may be subject to issues such as low response rates, lack of internet access, and potential for fraudulent responses.
- Telephone surveys: Trained interviewers administer the questionnaire over the phone. This mode allows for a large sample size and can result in higher response rates, but it is also more expensive and time-consuming than other modes.
- Face-to-face interviews : Trained interviewers administer the questionnaire in person. This mode allows for a high degree of control over the survey environment and can result in higher response rates, but it is also more expensive and time-consuming than other modes.
- Mixed-mode surveys: Researchers use a combination of two or more modes to administer the questionnaire, such as using online questionnaires for initial screening and following up with telephone interviews for more detailed information. This mode can help overcome some of the limitations of individual modes, but it requires careful planning and coordination.
Example of Questionnaire
Title of the Survey: Customer Satisfaction Survey
Introduction:
We appreciate your business and would like to ensure that we are meeting your needs. Please take a few minutes to complete this survey so that we can better understand your experience with our products and services. Your feedback is important to us and will help us improve our offerings.
Instructions:
Please read each question carefully and select the response that best reflects your experience. If you have any additional comments or suggestions, please feel free to include them in the space provided at the end of the survey.
1. How satisfied are you with our product quality?
- Very satisfied
- Somewhat satisfied
- Somewhat dissatisfied
- Very dissatisfied
2. How satisfied are you with our customer service?
3. How satisfied are you with the price of our products?
4. How likely are you to recommend our products to others?
- Very likely
- Somewhat likely
- Somewhat unlikely
- Very unlikely
5. How easy was it to find the information you were looking for on our website?
- Somewhat easy
- Somewhat difficult
- Very difficult
6. How satisfied are you with the overall experience of using our products and services?
7. Is there anything that you would like to see us improve upon or change in the future?
…………………………………………………………………………………………………………………………..
Conclusion:
Thank you for taking the time to complete this survey. Your feedback is valuable to us and will help us improve our products and services. If you have any further comments or concerns, please do not hesitate to contact us.
Applications of Questionnaire
Some common applications of questionnaires include:
- Research : Questionnaires are commonly used in research to gather information from participants about their attitudes, opinions, behaviors, and experiences. This information can then be analyzed and used to draw conclusions and make inferences.
- Healthcare : In healthcare, questionnaires can be used to gather information about patients’ medical history, symptoms, and lifestyle habits. This information can help healthcare professionals diagnose and treat medical conditions more effectively.
- Marketing : Questionnaires are commonly used in marketing to gather information about consumers’ preferences, buying habits, and opinions on products and services. This information can help businesses develop and market products more effectively.
- Human Resources: Questionnaires are used in human resources to gather information from job applicants, employees, and managers about job satisfaction, performance, and workplace culture. This information can help organizations improve their hiring practices, employee retention, and organizational culture.
- Education : Questionnaires are used in education to gather information from students, teachers, and parents about their perceptions of the educational experience. This information can help educators identify areas for improvement and develop more effective teaching strategies.
Purpose of Questionnaire
Some common purposes of questionnaires include:
- To collect information on attitudes, opinions, and beliefs: Questionnaires can be used to gather information on people’s attitudes, opinions, and beliefs on a particular topic. For example, a questionnaire can be used to gather information on people’s opinions about a particular political issue.
- To collect demographic information: Questionnaires can be used to collect demographic information such as age, gender, income, education level, and occupation. This information can be used to analyze trends and patterns in the data.
- To measure behaviors or experiences: Questionnaires can be used to gather information on behaviors or experiences such as health-related behaviors or experiences, job satisfaction, or customer satisfaction.
- To evaluate programs or interventions: Questionnaires can be used to evaluate the effectiveness of programs or interventions by gathering information on participants’ experiences, opinions, and behaviors.
- To gather information for research: Questionnaires can be used to gather data for research purposes on a variety of topics.
When to use Questionnaire
Here are some situations when questionnaires might be used:
- When you want to collect data from a large number of people: Questionnaires are useful when you want to collect data from a large number of people. They can be distributed to a wide audience and can be completed at the respondent’s convenience.
- When you want to collect data on specific topics: Questionnaires are useful when you want to collect data on specific topics or research questions. They can be designed to ask specific questions and can be used to gather quantitative data that can be analyzed statistically.
- When you want to compare responses across groups: Questionnaires are useful when you want to compare responses across different groups of people. For example, you might want to compare responses from men and women, or from people of different ages or educational backgrounds.
- When you want to collect data anonymously: Questionnaires can be useful when you want to collect data anonymously. Respondents can complete the questionnaire without fear of judgment or repercussions, which can lead to more honest and accurate responses.
- When you want to save time and resources: Questionnaires can be more efficient and cost-effective than other methods of data collection such as interviews or focus groups. They can be completed quickly and easily, and can be analyzed using software to save time and resources.
Characteristics of Questionnaire
Here are some of the characteristics of questionnaires:
- Standardization : Questionnaires are standardized tools that ask the same questions in the same order to all respondents. This ensures that all respondents are answering the same questions and that the responses can be compared and analyzed.
- Objectivity : Questionnaires are designed to be objective, meaning that they do not contain leading questions or bias that could influence the respondent’s answers.
- Predefined responses: Questionnaires typically provide predefined response options for the respondents to choose from, which helps to standardize the responses and make them easier to analyze.
- Quantitative data: Questionnaires are designed to collect quantitative data, meaning that they provide numerical or categorical data that can be analyzed using statistical methods.
- Convenience : Questionnaires are convenient for both the researcher and the respondents. They can be distributed and completed at the respondent’s convenience and can be easily administered to a large number of people.
- Anonymity : Questionnaires can be anonymous, which can encourage respondents to answer more honestly and provide more accurate data.
- Reliability : Questionnaires are designed to be reliable, meaning that they produce consistent results when administered multiple times to the same group of people.
- Validity : Questionnaires are designed to be valid, meaning that they measure what they are intended to measure and are not influenced by other factors.
Advantage of Questionnaire
Some Advantage of Questionnaire are as follows:
- Standardization: Questionnaires allow researchers to ask the same questions to all participants in a standardized manner. This helps ensure consistency in the data collected and eliminates potential bias that might arise if questions were asked differently to different participants.
- Efficiency: Questionnaires can be administered to a large number of people at once, making them an efficient way to collect data from a large sample.
- Anonymity: Participants can remain anonymous when completing a questionnaire, which may make them more likely to answer honestly and openly.
- Cost-effective: Questionnaires can be relatively inexpensive to administer compared to other research methods, such as interviews or focus groups.
- Objectivity: Because questionnaires are typically designed to collect quantitative data, they can be analyzed objectively without the influence of the researcher’s subjective interpretation.
- Flexibility: Questionnaires can be adapted to a wide range of research questions and can be used in various settings, including online surveys, mail surveys, or in-person interviews.
Limitations of Questionnaire
Limitations of Questionnaire are as follows:
- Limited depth: Questionnaires are typically designed to collect quantitative data, which may not provide a complete understanding of the topic being studied. Questionnaires may miss important details and nuances that could be captured through other research methods, such as interviews or observations.
- R esponse bias: Participants may not always answer questions truthfully or accurately, either because they do not remember or because they want to present themselves in a particular way. This can lead to response bias, which can affect the validity and reliability of the data collected.
- Limited flexibility: While questionnaires can be adapted to a wide range of research questions, they may not be suitable for all types of research. For example, they may not be appropriate for studying complex phenomena or for exploring participants’ experiences and perceptions in-depth.
- Limited context: Questionnaires typically do not provide a rich contextual understanding of the topic being studied. They may not capture the broader social, cultural, or historical factors that may influence participants’ responses.
- Limited control : Researchers may not have control over how participants complete the questionnaire, which can lead to variations in response quality or consistency.
About the author

Muhammad Hassan
Researcher, Academic Writer, Web developer
You may also like

Transformative Design – Methods, Types, Guide

Correlational Research – Methods, Types and...

Focus Groups – Steps, Examples and Guide

Qualitative Research – Methods, Analysis Types...

Observational Research – Methods and Guide

One-to-One Interview – Methods and Guide
- What is New
- Download Your Software
- Behavioral Research
- Software for Consumer Research
- Software for Human Factors R&D
- Request Live Demo
- Contact Sales
Sensor Hardware

We carry a range of biosensors from the top hardware producers. All compatible with iMotions
iMotions for Higher Education
Imotions for business.

Neurogaming: Bridging the Mind and Machine in the Gaming Universe
Consumer Insights
Morten Pedersen

Neuroeconomics: The Best of Neuroscience, Psychology, and Economics
News & events.
- iMotions Lab
- iMotions Online
- Eye Tracking
- Eye Tracking Screen Based
- Eye Tracking VR
- Eye Tracking Glasses
- Eye Tracking Webcam
- FEA (Facial Expression Analysis)
- Voice Analysis
- EDA/GSR (Electrodermal Activity)
- EEG (Electroencephalography)
- ECG (Electrocardiography)
- EMG (Electromyography)
- Respiration
- iMotions Lab: New features
- iMotions Lab: Developers
- EEG sensors
- Sensory and Perceptual
- Consumer Inights
- Human Factors R&D
- Work Environments, Training and Safety
- Customer Stories
- Published Research Papers
- Document Library
- Customer Support Program
- Help Center
- Release Notes
- Contact Support
- Partnerships
- Mission Statement
- Ownership and Structure
- Executive Management
- Job Opportunities
Publications
- Newsletter Sign Up
How to Design a Questionnaire

Bryn Farnsworth
In this guide on how to design a questionnaire, we take you through what a good questionnaire is, how to perfect your design and questions, as well as how best to implement the questionnaire in your research. At the end of the guide, readers will have a thorough understanding of how to design a questionnaire, as well as have the opportunity to download our experimental design guide for free for future reference when building studies and experiments.
Table of Contents
If you want to find out something about a person, you’d usually just ask them. If you want to ask a few questions for a group of people, maybe you’d get together as a group. If you want to do research on the answers, you’d give them a questionnaire.
Questionnaires are a crucial part of research. There are many other tools that are used to find out about how people think, feel, and act, but the act of asking remains central to finding out what people explicitly think.
While questionnaires have likely been used for hundreds of years [1], the first recorded instance arose from the result of the work of Adolphe Quetelet , a French polymath, in 1835. He was interested in applying the same rigorous methodologies applied to natural science as to the humanities. By recording – through questionnaires (well, technically surveys) – the physical characteristics of soldiers, he essentially invented the field of sociology. This all goes to say: questionnaires can be powerful things.
Despite the lengthy and illustrious history of questionnaires, they are still not used necessarily in the right way. There remain various ways to carry out such work, and many pitfalls abound.
Below, we will define what a questionnaire actually is (including what separates it from surveys), and provide a guide to making one in the best possible way.
What are questionnaires?
Questionnaires are a set of written questions designed to gather standardized information about the opinions, preferences, experiences, intentions, and behavior of individuals, and can be devised for the purposes of a scientific study. Traditionally, they have been said to contrast with surveys in the sense that they do not collect mass data for further analysis, however the terms are largely used interchangeably these days (and many research studies also use them together).
While questionnaires provide a comparatively cheap, prompt, and efficient means of obtaining large amounts of information, questionnaire design is a multistage process that requires attention to a number of aspects at the same time to gather the information you seek. Why exactly is that?
Depending on the kind of information you aim to acquire, questions need to be asked in varying degrees of detail and in specific ways.
Given the same topic, it’s rather likely that different researchers will come up with different questionnaires that vary widely in their choice of questions, a line of questioning, use of open-ended questions, and length.
Question everything – what makes a good questionnaire?
Basically, well-designed questionnaires are highly structured to allow the same types of information to be collected from a large number of respondents in the same way and for data to be analyzed quantitatively .
Open and Closed Questionnaire Formats
Among others, the design of your questionnaire will depend on whether you choose an open format to collect exploratory information or a closed format to acquire quantitative data.
Advantages of open format:
- Allows to explore the range of possible topics arising from your research question
- Supports the understanding and generation of hypotheses on a topic
Advantages of closed format (multiple choice):
- Easy and quick to complete
- Ensures all respondents receive same stimuli
- Easy to record and analyze results quantitatively
Now how should you go about it? Planning and preparation are key. Although questionnaire design can seem simple at the surface, there are several components you want to make sure you get right. Before you know how to exactly phrase your questions, you need to define the goals and aims of your research, understand who you’ll be talking to, and design everything accordingly. Below, we go through exactly how to do this.
Six steps to good questionnaire design
#1: identify your research aims and the goal of your questionnaire.
What kind of information do you want to gather with your questionnaire? What is your main objective?
Ideally, there are already existing questionnaires that have been validated by published research that you can use (or maybe just to borrow a couple of ideas from). This can occur frequently within psychological research, as there is a broad range of research being carried out in a variety of different fields.
While this can be quite common, it’s not always the case. It might, for example, be rather difficult to find or reuse existing questionnaires for commercial applications. In this case, you might still be able to draw inspiration from pre-existing research, although greater care in the following steps will likely be needed.
Interested in Human Behavior and Psychology?
Sign up to our newsletter to get the latest articles and research send to you

#2: Define your target respondents
Clearly, you can’t test everyone – it’s rather plausible that there have to be certain restrictions with respect to the target audience of your questionnaire. The selection of groups is a key factor for maximizing the robustness of your study.
Another aspect to consider is whether you want to run multiple questionnaire sessions over a longer period of time with a single group ( longitudinal design ), or if you want to present your questionnaire once to two or more groups ( cross-sectional design ).
While the former allows you to analyze how the questionnaire results of the group change over time, the latter delivers insights into differences among groups.
#3: Develop questions
Smart questions are the cornerstone of every questionnaire. To make them work, they have to be phrased in a way that prevents any misunderstandings or ambiguities.
It’s often a lost cause trying to analyze data from a questionnaire where people have mixed things up, selected incorrect answers or haven’t been able to read or understand the questions at all.
It makes a significant difference whether you want to hand a questionnaire to children, adults, or maybe even elderly participants. It’s important to consider the cognitive, attentional, and sensory competencies of your target group – handing out long questionnaires with a huge amount of questions in small letter print and complicated phrasing might be too taxing for many participant groups.
Additionally, remember to avoid jargon or technical language – the text needs to be fully understood by anyone completing the questionnaire.
#4: Choose your question type
There’s a wide variety in how to phrase questions. In explorative questionnaires, you will find mainly open questions, where participants can fill in any answer (this makes sense whenever you try to gain an understanding of the topics associated with your research question).
By contrast, quantitative questionnaires primarily include closed-questions, which have been predefined by the researcher either in form of multiple choice answers or rating scales (such as the Likert scale ).
Here’s one example:
Open question:
“What did you like about the webinar?”
Closed question:
“The webinar was useful.”
[ ] Strongly agree
[ ] Agree
[ ] Cannot decide
[ ] Disagree
[ ] Strongly disagree
As is usually the case, both types of questions have benefits and drawbacks that are worth considering in order to come up with a solid questionnaire design that does the trick for you.
Besides open and closed-format questions, there are several other types of questions that you can use in your questionnaire.
#5: Design question sequence and overall layout
After optimizing each question separately it is time to improve the overall flow and layout of the questionnaire.
Are there transitions from one question to the next? Are follow-up questions placed correctly? Are skip-rules implemented (if needed) so that participants can skip questions that do not apply to them?
Keep up with the latest in human behavior research and technological developments
#6: Run a pilot
This stage is crucial for evaluation and optimization purposes. Any questionnaire should be handed to a representative sample of your target audience before you go further with it.
During piloting, you can identify issues in readability and understanding, in phrasing and overall arrangement. It could be helpful to discuss the questionnaire with pilot participants to better understand their experience. Also, keep in mind to evaluate your pilot data statistically to make sure that the analytic procedures of interest truly can be applied to the data.
I hope this post helps you set out your questionnaire or survey design. If you’d like to learn more about the fundamentals of experimental design, then download our free guide below.
Free 44-page Experimental Design Guide
For Beginners and Intermediates
- Introduction to experimental methods
- Respondent management with groups and populations
- How to set up stimulus selection and arrangement

[1] Gault, R. (1907). A History of the Questionnaire Method of Research in Psychology. The Pedagogical Seminary , 14(3), 366-383. doi: 10.1080/08919402.1907.10532551
Last edited
About the author
See what is next in human behavior research
Follow our newsletter to get the latest insights and events send to your inbox.
Related Posts

Roles of Independent and Dependent Variables in Research

Participant Recruitment for Human Behavior Studies: Strategies, Challenges, and Considerations
How to manage data quality
Paolo Masulli

Why are citations important in science?
You might also like these.

What is Attribution Theory?

What is the Observer Effect?
Case Stories
Explore Blog Categories
Best Practice
Collaboration, product guides, product news, research fundamentals, research insights, 🍪 use of cookies.
We are committed to protecting your privacy and only use cookies to improve the user experience.
Chose which third-party services that you will allow to drop cookies. You can always change your cookie settings via the Cookie Settings link in the footer of the website. For more information read our Privacy Policy.
- gtag This tag is from Google and is used to associate user actions with Google Ad campaigns to measure their effectiveness. Enabling this will load the gtag and allow for the website to share information with Google. This service is essential and can not be disabled.
- Livechat Livechat provides you with direct access to the experts in our office. The service tracks visitors to the website but does not store any information unless consent is given. This service is essential and can not be disabled.
- Pardot Collects information such as the IP address, browser type, and referring URL. This information is used to create reports on website traffic and track the effectiveness of marketing campaigns.
- Third-party iFrames Allows you to see thirdparty iFrames.

How to Design Effective Research Questionnaires for Robust Findings
As a staple in data collection, questionnaires help uncover robust and reliable findings that can transform industries, shape policies, and revolutionize understanding. Whether you are exploring societal trends or delving into scientific phenomena, the effectiveness of your research questionnaire can make or break your findings.
In this article, we aim to understand the core purpose of questionnaires, exploring how they serve as essential tools for gathering systematic data, both qualitative and quantitative, from diverse respondents. Read on as we explore the key elements that make up a winning questionnaire, the art of framing questions which are both compelling and rigorous, and the careful balance between simplicity and depth.
Table of Contents
The Role of Questionnaires in Research
So, what is a questionnaire? A questionnaire is a structured set of questions designed to collect information, opinions, attitudes, or behaviors from respondents. It is one of the most commonly used data collection methods in research. Moreover, questionnaires can be used in various research fields, including social sciences, market research, healthcare, education, and psychology. Their adaptability makes them suitable for investigating diverse research questions.
Questionnaire and survey are two terms often used interchangeably, but they have distinct meanings in the context of research. A survey refers to the broader process of data collection that may involve various methods. A survey can encompass different data collection techniques, such as interviews , focus groups, observations, and yes, questionnaires.
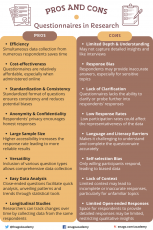
Pros and Cons of Using Questionnaires in Research:
While questionnaires offer numerous advantages in research, they also come with some disadvantages that researchers must be aware of and address appropriately. Careful questionnaire design, validation, and consideration of potential biases can help mitigate these disadvantages and enhance the effectiveness of using questionnaires as a data collection method.
Structured vs Unstructured Questionnaires
Structured questionnaire:.
A structured questionnaire consists of questions with predefined response options. Respondents are presented with a fixed set of choices and are required to select from those options. The questions in a structured questionnaire are designed to elicit specific and quantifiable responses. Structured questionnaires are particularly useful for collecting quantitative data and are often employed in surveys and studies where standardized and comparable data are necessary.
Advantages of Structured Questionnaires:
- Easy to analyze and interpret: The fixed response options facilitate straightforward data analysis and comparison across respondents.
- Efficient for large-scale data collection: Structured questionnaires are time-efficient, allowing researchers to collect data from a large number of respondents.
- Reduces response bias: The predefined response options minimize potential response bias and maintain consistency in data collection.
Limitations of Structured Questionnaires:
- Lack of depth: Structured questionnaires may not capture in-depth insights or nuances as respondents are limited to pre-defined response choices. Hence, they may not reveal the reasons behind respondents’ choices, limiting the understanding of their perspectives.
- Limited flexibility: The fixed response options may not cover all potential responses, therefore, potentially restricting respondents’ answers.
Unstructured Questionnaire:
An unstructured questionnaire consists of questions that allow respondents to provide detailed and unrestricted responses. Unlike structured questionnaires, there are no predefined response options, giving respondents the freedom to express their thoughts in their own words. Furthermore, unstructured questionnaires are valuable for collecting qualitative data and obtaining in-depth insights into respondents’ experiences, opinions, or feelings.
Advantages of Unstructured Questionnaires:
- Rich qualitative data: Unstructured questionnaires yield detailed and comprehensive qualitative data, providing valuable and novel insights into respondents’ perspectives.
- Flexibility in responses: Respondents have the freedom to express themselves in their own words. Hence, allowing for a wide range of responses.
Limitations of Unstructured Questionnaires:
- Time-consuming analysis: Analyzing open-ended responses can be time-consuming, since, each response requires careful reading and interpretation.
- Subjectivity in interpretation: The analysis of open-ended responses may be subjective, as researchers interpret and categorize responses based on their judgment.
- May require smaller sample size: Due to the depth of responses, researchers may need a smaller sample size for comprehensive analysis, making generalizations more challenging.
Types of Questions in a Questionnaire
In a questionnaire, researchers typically use the following most common types of questions to gather a variety of information from respondents:
1. Open-Ended Questions:
These questions allow respondents to provide detailed and unrestricted responses in their own words. Open-ended questions are valuable for gathering qualitative data and in-depth insights.
Example: What suggestions do you have for improving our product?
2. Multiple-Choice Questions
Respondents choose one answer from a list of provided options. This type of question is suitable for gathering categorical data or preferences.
Example: Which of the following social media/academic networking platforms do you use to promote your research?
- ResearchGate
- Academia.edu
3. Dichotomous Questions
Respondents choose between two options, typically “yes” or “no”, “true” or “false”, or “agree” or “disagree”.
Example: Have you ever published in open access journals before?
4. Scaling Questions
These questions, also known as rating scale questions, use a predefined scale that allows respondents to rate or rank their level of agreement, satisfaction, importance, or other subjective assessments. These scales help researchers quantify subjective data and make comparisons across respondents.
There are several types of scaling techniques used in scaling questions:
i. Likert Scale:
The Likert scale is one of the most common scaling techniques. It presents respondents with a series of statements and asks them to rate their level of agreement or disagreement using a range of options, typically from “strongly agree” to “strongly disagree”.For example: Please indicate your level of agreement with the statement: “The content presented in the webinar was relevant and aligned with the advertised topic.”
- Strongly Agree
- Strongly Disagree
ii. Semantic Differential Scale:
The semantic differential scale measures respondents’ perceptions or attitudes towards an item using opposite adjectives or bipolar words. Respondents rate the item on a scale between the two opposites. For example:
- Easy —— Difficult
- Satisfied —— Unsatisfied
- Very likely —— Very unlikely
iii. Numerical Rating Scale:
This scale requires respondents to provide a numerical rating on a predefined scale. It can be a simple 1 to 5 or 1 to 10 scale, where higher numbers indicate higher agreement, satisfaction, or importance.
iv. Ranking Questions:
Respondents rank items in order of preference or importance. Ranking questions help identify preferences or priorities.
Example: Please rank the following features of our app in order of importance (1 = Most Important, 5 = Least Important):
- User Interface
- Functionality
- Customer Support
By using a mix of question types, researchers can gather both quantitative and qualitative data, providing a comprehensive understanding of the research topic and enabling meaningful analysis and interpretation of the results. The choice of question types depends on the research objectives , the desired depth of information, and the data analysis requirements.
Methods of Administering Questionnaires
There are several methods for administering questionnaires, and the choice of method depends on factors such as the target population, research objectives , convenience, and resources available. Here are some common methods of administering questionnaires:
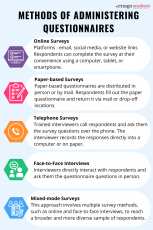
Each method has its advantages and limitations. Online surveys offer convenience and a large reach, but they may be limited to individuals with internet access. Face-to-face interviews allow for in-depth responses but can be time-consuming and costly. Telephone surveys have broad reach but may be limited by declining response rates. Researchers should choose the method that best suits their research objectives, target population, and available resources to ensure successful data collection.
How to Design a Questionnaire
Designing a good questionnaire is crucial for gathering accurate and meaningful data that aligns with your research objectives. Here are essential steps and tips to create a well-designed questionnaire:
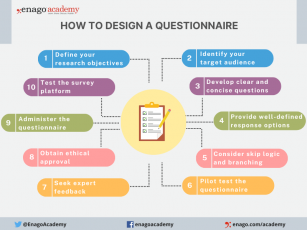
1. Define Your Research Objectives : Clearly outline the purpose and specific information you aim to gather through the questionnaire.
2. Identify Your Target Audience : Understand respondents’ characteristics and tailor the questionnaire accordingly.
3. Develop the Questions :
- Write Clear and Concise Questions
- Avoid Leading or Biasing Questions
- Sequence Questions Logically
- Group Related Questions
- Include Demographic Questions
4. Provide Well-defined Response Options : Offer exhaustive response choices for closed-ended questions.
5. Consider Skip Logic and Branching : Customize the questionnaire based on previous answers.
6. Pilot Test the Questionnaire : Identify and address issues through a pilot study .
7. Seek Expert Feedback : Validate the questionnaire with subject matter experts.
8. Obtain Ethical Approval : Comply with ethical guidelines , obtain consent, and ensure confidentiality before administering the questionnaire.
9. Administer the Questionnaire : Choose the right mode and provide clear instructions.
10. Test the Survey Platform : Ensure compatibility and usability for online surveys.
By following these steps and paying attention to questionnaire design principles, you can create a well-structured and effective questionnaire that gathers reliable data and helps you achieve your research objectives.
Characteristics of a Good Questionnaire
A good questionnaire possesses several essential elements that contribute to its effectiveness. Furthermore, these characteristics ensure that the questionnaire is well-designed, easy to understand, and capable of providing valuable insights. Here are some key characteristics of a good questionnaire:
1. Clarity and Simplicity : Questions should be clear, concise, and unambiguous. Avoid using complex language or technical terms that may confuse respondents. Simple and straightforward questions ensure that respondents interpret them consistently.
2. Relevance and Focus : Each question should directly relate to the research objectives and contribute to answering the research questions. Consequently, avoid including extraneous or irrelevant questions that could lead to data clutter.
3. Mix of Question Types : Utilize a mix of question types, including open-ended, Likert scale, and multiple-choice questions. This variety allows for both qualitative and quantitative data collections .
4. Validity and Reliability : Ensure the questionnaire measures what it intends to measure (validity) and produces consistent results upon repeated administration (reliability). Validation should be conducted through expert review and previous research.
5. Appropriate Length : Keep the questionnaire’s length appropriate and manageable to avoid respondent fatigue or dropouts. Long questionnaires may result in incomplete or rushed responses.
6. Clear Instructions : Include clear instructions at the beginning of the questionnaire to guide respondents on how to complete it. Explain any technical terms, formats, or concepts if necessary.
7. User-Friendly Format : Design the questionnaire to be visually appealing and user-friendly. Use consistent formatting, adequate spacing, and a logical page layout.
8. Data Validation and Cleaning : Incorporate validation checks to ensure data accuracy and reliability. Consider mechanisms to detect and correct inconsistent or missing responses during data cleaning.
By incorporating these characteristics, researchers can create a questionnaire that maximizes data quality, minimizes response bias, and provides valuable insights for their research.
In the pursuit of advancing research and gaining meaningful insights, investing time and effort into designing effective questionnaires is a crucial step. A well-designed questionnaire is more than a mere set of questions; it is a masterpiece of precision and ingenuity. Each question plays a vital role in shaping the narrative of our research, guiding us through the labyrinth of data to meaningful conclusions. Indeed, a well-designed questionnaire serves as a powerful tool for unlocking valuable insights and generating robust findings that impact society positively.
Have you ever designed a research questionnaire? Reflect on your experience and share your insights with researchers globally through Enago Academy’s Open Blogging Platform . Join our diverse community of 1000K+ researchers and authors to exchange ideas, strategies, and best practices, and together, let’s shape the future of data collection and maximize the impact of questionnaires in the ever-evolving landscape of research.
Frequently Asked Questions
A research questionnaire is a structured tool used to gather data from participants in a systematic manner. It consists of a series of carefully crafted questions designed to collect specific information related to a research study.
Questionnaires play a pivotal role in both quantitative and qualitative research, enabling researchers to collect insights, opinions, attitudes, or behaviors from respondents. This aids in hypothesis testing, understanding, and informed decision-making, ensuring consistency, efficiency, and facilitating comparisons.
Questionnaires are a versatile tool employed in various research designs to gather data efficiently and comprehensively. They find extensive use in both quantitative and qualitative research methodologies, making them a fundamental component of research across disciplines. Some research designs that commonly utilize questionnaires include: a) Cross-Sectional Studies b) Longitudinal Studies c) Descriptive Research d) Correlational Studies e) Causal-Comparative Studies f) Experimental Research g) Survey Research h) Case Studies i) Exploratory Research
A survey is a comprehensive data collection method that can include various techniques like interviews and observations. A questionnaire is a specific set of structured questions within a survey designed to gather standardized responses. While a survey is a broader approach, a questionnaire is a focused tool for collecting specific data.
The choice of questionnaire type depends on the research objectives, the type of data required, and the preferences of respondents. Some common types include: • Structured Questionnaires: These questionnaires consist of predefined, closed-ended questions with fixed response options. They are easy to analyze and suitable for quantitative research. • Semi-Structured Questionnaires: These questionnaires combine closed-ended questions with open-ended ones. They offer more flexibility for respondents to provide detailed explanations. • Unstructured Questionnaires: These questionnaires contain open-ended questions only, allowing respondents to express their thoughts and opinions freely. They are commonly used in qualitative research.
Following these steps ensures effective questionnaire administration for reliable data collection: • Choose a Method: Decide on online, face-to-face, mail, or phone administration. • Online Surveys: Use platforms like SurveyMonkey • Pilot Test: Test on a small group before full deployment • Clear Instructions: Provide concise guidelines • Follow-Up: Send reminders if needed

Thank you, Riya. This is quite helpful. As discussed, response bias is one of the disadvantages in the use of questionnaires. One way to help limit this can be to use scenario based questions. These type of questions may help the respondents to be more reflective and active in the process.
Thank you, Dear Riya. This is quite helpful.
Great insights there Doc
Rate this article Cancel Reply
Your email address will not be published.

Enago Academy's Most Popular Articles

- Industry News
Google Releases 2024 Scholar Metrics, Evaluates Impact of Scholarly Articles
Google has released its 2024 Scholar Metrics, assessing scholarly articles from 2019 to 2023. This…
![What is Academic Integrity and How to Uphold it [FREE CHECKLIST]](https://www.enago.com/academy/wp-content/uploads/2024/05/FeatureImages-59-210x136.png "questionnaire for a research paper")
Ensuring Academic Integrity and Transparency in Academic Research: A comprehensive checklist for researchers
Academic integrity is the foundation upon which the credibility and value of scientific findings are…

- Publishing Research
- Reporting Research
How to Optimize Your Research Process: A step-by-step guide
For researchers across disciplines, the path to uncovering novel findings and insights is often filled…

- Trending Now
Breaking Barriers: Sony and Nature unveil “Women in Technology Award”
Sony Group Corporation and the prestigious scientific journal Nature have collaborated to launch the inaugural…

Achieving Research Excellence: Checklist for good research practices
Academia is built on the foundation of trustworthy and high-quality research, supported by the pillars…
Choosing the Right Analytical Approach: Thematic analysis vs. content analysis for…
Comparing Cross Sectional and Longitudinal Studies: 5 steps for choosing the right…
Research Recommendations – Guiding policy-makers for evidence-based decision making

Sign-up to read more
Subscribe for free to get unrestricted access to all our resources on research writing and academic publishing including:
- 2000+ blog articles
- 50+ Webinars
- 10+ Expert podcasts
- 50+ Infographics
- 10+ Checklists
- Research Guides
We hate spam too. We promise to protect your privacy and never spam you.
- AI in Academia
- Promoting Research
- Career Corner
- Diversity and Inclusion
- Infographics
- Expert Video Library
- Other Resources
- Enago Learn
- Upcoming & On-Demand Webinars
- Peer-Review Week 2023
- Open Access Week 2023
- Conference Videos
- Enago Report
- Journal Finder
- Enago Plagiarism & AI Grammar Check
- Editing Services
- Publication Support Services
- Research Impact
- Translation Services
- Publication solutions
- AI-Based Solutions
- Thought Leadership
- Call for Articles
- Call for Speakers
- Author Training
- Edit Profile
I am looking for Editing/ Proofreading services for my manuscript Tentative date of next journal submission:

In your opinion, what is the most effective way to improve integrity in the peer review process?
- PRO Courses Guides New Tech Help Pro Expert Videos About wikiHow Pro Upgrade Sign In
- EDIT Edit this Article
- EXPLORE Tech Help Pro About Us Random Article Quizzes Request a New Article Community Dashboard This Or That Game Happiness Hub Popular Categories Arts and Entertainment Artwork Books Movies Computers and Electronics Computers Phone Skills Technology Hacks Health Men's Health Mental Health Women's Health Relationships Dating Love Relationship Issues Hobbies and Crafts Crafts Drawing Games Education & Communication Communication Skills Personal Development Studying Personal Care and Style Fashion Hair Care Personal Hygiene Youth Personal Care School Stuff Dating All Categories Arts and Entertainment Finance and Business Home and Garden Relationship Quizzes Cars & Other Vehicles Food and Entertaining Personal Care and Style Sports and Fitness Computers and Electronics Health Pets and Animals Travel Education & Communication Hobbies and Crafts Philosophy and Religion Work World Family Life Holidays and Traditions Relationships Youth
- Browse Articles
- Learn Something New
- Quizzes Hot
- Happiness Hub
- This Or That Game
- Train Your Brain
- Explore More
- Support wikiHow
- About wikiHow
- Log in / Sign up
- Education and Communications
How to Develop a Questionnaire for Research
Last Updated: July 21, 2024 Fact Checked
This article was co-authored by Alexander Ruiz, M.Ed. . Alexander Ruiz is an Educational Consultant and the Educational Director of Link Educational Institute, a tutoring business based in Claremont, California that provides customizable educational plans, subject and test prep tutoring, and college application consulting. With over a decade and a half of experience in the education industry, Alexander coaches students to increase their self-awareness and emotional intelligence while achieving skills and the goal of achieving skills and higher education. He holds a BA in Psychology from Florida International University and an MA in Education from Georgia Southern University. There are 12 references cited in this article, which can be found at the bottom of the page. This article has been fact-checked, ensuring the accuracy of any cited facts and confirming the authority of its sources. This article has been viewed 592,234 times.
A questionnaire is a technique for collecting data in which a respondent provides answers to a series of questions. [1] X Research source To develop a questionnaire that will collect the data you want takes effort and time. However, by taking a step-by-step approach to questionnaire development, you can come up with an effective means to collect data that will answer your unique research question.
Designing Your Questionnaire

- Come up with a research question. It can be one question or several, but this should be the focal point of your questionnaire.
- Develop one or several hypotheses that you want to test. The questions that you include on your questionnaire should be aimed at systematically testing these hypotheses.

- Dichotomous question: this is a question that will generally be a “yes/no” question, but may also be an “agree/disagree” question. It is the quickest and simplest question to analyze, but is not a highly sensitive measure.
- Open-ended questions: these questions allow the respondent to respond in their own words. They can be useful for gaining insight into the feelings of the respondent, but can be a challenge when it comes to analysis of data. It is recommended to use open-ended questions to address the issue of “why.” [2] X Research source
- Multiple choice questions: these questions consist of three or more mutually-exclusive categories and ask for a single answer or several answers. [3] X Research source Multiple choice questions allow for easy analysis of results, but may not give the respondent the answer they want.
- Rank-order (or ordinal) scale questions: this type of question asks your respondent to rank items or choose items in a particular order from a set. For example, it might ask your respondents to order five things from least to most important. These types of questions forces discrimination among alternatives, but does not address the issue of why the respondent made these discriminations. [4] X Research source
- Rating scale questions: these questions allow the respondent to assess a particular issue based on a given dimension. You can provide a scale that gives an equal number of positive and negative choices, for example, ranging from “strongly agree” to “strongly disagree.” [5] X Research source These questions are very flexible, but also do not answer the question “why.”

- Write questions that are succinct and simple. You should not be writing complex statements or using technical jargon, as it will only confuse your respondents and lead to incorrect responses.
- Ask only one question at a time. This will help avoid confusion
- Asking questions such as these usually require you to anonymize or encrypt the demographic data you collect.
- Determine if you will include an answer such as “I don’t know” or “Not applicable to me.” While these can give your respondents a way of not answering certain questions, providing these options can also lead to missing data, which can be problematic during data analysis.
- Put the most important questions at the beginning of your questionnaire. This can help you gather important data even if you sense that your respondents may be becoming distracted by the end of the questionnaire.

- Only include questions that are directly useful to your research question. [8] X Trustworthy Source Food and Agricultural Organization of the United Nations Specialized agency of the United Nations responsible for leading international efforts to end world hunger and improve nutrition Go to source A questionnaire is not an opportunity to collect all kinds of information about your respondents.
- Avoid asking redundant questions. This will frustrate those who are taking your questionnaire.

- Consider if you want your questionnaire to collect information from both men and women. Some studies will only survey one sex.
- Consider including a range of ages in your target demographic. For example, you can consider young adult to be 18-29 years old, adults to be 30-54 years old, and mature adults to be 55+. Providing the an age range will help you get more respondents than limiting yourself to a specific age.
- Consider what else would make a person a target for your questionnaire. Do they need to drive a car? Do they need to have health insurance? Do they need to have a child under 3? Make sure you are very clear about this before you distribute your questionnaire.

- Consider an anonymous questionnaire. You may not want to ask for names on your questionnaire. This is one step you can take to prevent privacy, however it is often possible to figure out a respondent’s identity using other demographic information (such as age, physical features, or zipcode).
- Consider de-identifying the identity of your respondents. Give each questionnaire (and thus, each respondent) a unique number or word, and only refer to them using that new identifier. Shred any personal information that can be used to determine identity.
- Remember that you do not need to collect much demographic information to be able to identify someone. People may be wary to provide this information, so you may get more respondents by asking less demographic questions (if it is possible for your questionnaire).
- Make sure you destroy all identifying information after your study is complete.
Writing your questionnaire

- My name is Jack Smith and I am one of the creators of this questionnaire. I am part of the Department of Psychology at the University of Michigan, where I am focusing in developing cognition in infants.
- I’m Kelly Smith, a 3rd year undergraduate student at the University of New Mexico. This questionnaire is part of my final exam in statistics.
- My name is Steve Johnson, and I’m a marketing analyst for The Best Company. I’ve been working on questionnaire development to determine attitudes surrounding drug use in Canada for several years.

- I am collecting data regarding the attitudes surrounding gun control. This information is being collected for my Anthropology 101 class at the University of Maryland.
- This questionnaire will ask you 15 questions about your eating and exercise habits. We are attempting to make a correlation between healthy eating, frequency of exercise, and incidence of cancer in mature adults.
- This questionnaire will ask you about your recent experiences with international air travel. There will be three sections of questions that will ask you to recount your recent trips and your feelings surrounding these trips, as well as your travel plans for the future. We are looking to understand how a person’s feelings surrounding air travel impact their future plans.

- Beware that if you are collecting information for a university or for publication, you may need to check in with your institution’s Institutional Review Board (IRB) for permission before beginning. Most research universities have a dedicated IRB staff, and their information can usually be found on the school’s website.
- Remember that transparency is best. It is important to be honest about what will happen with the data you collect.
- Include an informed consent for if necessary. Note that you cannot guarantee confidentiality, but you will make all reasonable attempts to ensure that you protect their information. [11] X Research source

- Time yourself taking the survey. Then consider that it will take some people longer than you, and some people less time than you.
- Provide a time range instead of a specific time. For example, it’s better to say that a survey will take between 15 and 30 minutes than to say it will take 15 minutes and have some respondents quit halfway through.
- Use this as a reason to keep your survey concise! You will feel much better asking people to take a 20 minute survey than you will asking them to take a 3 hour one.

- Incentives can attract the wrong kind of respondent. You don’t want to incorporate responses from people who rush through your questionnaire just to get the reward at the end. This is a danger of offering an incentive. [12] X Research source
- Incentives can encourage people to respond to your survey who might not have responded without a reward. This is a situation in which incentives can help you reach your target number of respondents. [13] X Research source
- Consider the strategy used by SurveyMonkey. Instead of directly paying respondents to take their surveys, they offer 50 cents to the charity of their choice when a respondent fills out a survey. They feel that this lessens the chances that a respondent will fill out a questionnaire out of pure self-interest. [14] X Research source
- Consider entering each respondent in to a drawing for a prize if they complete the questionnaire. You can offer a 25$ gift card to a restaurant, or a new iPod, or a ticket to a movie. This makes it less tempting just to respond to your questionnaire for the incentive alone, but still offers the chance of a pleasant reward.

- Always proof read. Check for spelling, grammar, and punctuation errors.
- Include a title. This is a good way for your respondents to understand the focus of the survey as quickly as possible.
- Thank your respondents. Thank them for taking the time and effort to complete your survey.
Distributing Your Questionnaire

- Was the questionnaire easy to understand? Were there any questions that confused you?
- Was the questionnaire easy to access? (Especially important if your questionnaire is online).
- Do you feel the questionnaire was worth your time?
- Were you comfortable answering the questions asked?
- Are there any improvements you would make to the questionnaire?

- Use an online site, such as SurveyMonkey.com. This site allows you to write your own questionnaire with their survey builder, and provides additional options such as the option to buy a target audience and use their analytics to analyze your data. [18] X Research source
- Consider using the mail. If you mail your survey, always make sure you include a self-addressed stamped envelope so that the respondent can easily mail their responses back. Make sure that your questionnaire will fit inside a standard business envelope.
- Conduct face-to-face interviews. This can be a good way to ensure that you are reaching your target demographic and can reduce missing information in your questionnaires, as it is more difficult for a respondent to avoid answering a question when you ask it directly.
- Try using the telephone. While this can be a more time-effective way to collect your data, it can be difficult to get people to respond to telephone questionnaires.

- Make your deadline reasonable. Giving respondents up to 2 weeks to answer should be more than sufficient. Anything longer and you risk your respondents forgetting about your questionnaire.
- Consider providing a reminder. A week before the deadline is a good time to provide a gentle reminder about returning the questionnaire. Include a replacement of the questionnaire in case it has been misplaced by your respondent.
Community Q&A
You Might Also Like

- ↑ https://www.questionpro.com/blog/what-is-a-questionnaire/
- ↑ https://www.hotjar.com/blog/open-ended-questions/
- ↑ https://www.questionpro.com/a/showArticle.do?articleID=survey-questions
- ↑ https://surveysparrow.com/blog/ranking-questions-examples/
- ↑ https://www.lumoa.me/blog/rating-scale/
- ↑ http://www.sciencebuddies.org/science-fair-projects/project_ideas/Soc_survey.shtml
- ↑ http://www.fao.org/docrep/W3241E/w3241e05.htm
- ↑ http://managementhelp.org/businessresearch/questionaires.htm
- ↑ https://www.surveymonkey.com/mp/survey-rewards/
- ↑ http://www.ideafit.com/fitness-library/how-to-develop-a-questionnaire
- ↑ https://www.surveymonkey.com/mp/take-a-tour/?ut_source=header
About This Article

To develop a questionnaire for research, identify the main objective of your research to act as the focal point for the questionnaire. Then, choose the type of questions that you want to include, and come up with succinct, straightforward questions to gather the information that you need to answer your questions. Keep your questionnaire as short as possible, and identify a target demographic who you would like to answer the questions. Remember to make the questionnaires as anonymous as possible to protect the integrity of the person answering the questions! For tips on writing out your questions and distributing the questionnaire, keep reading! Did this summary help you? Yes No
- Send fan mail to authors
Reader Success Stories
Abdul Bari Khan
Nov 11, 2020
Did this article help you?
Jul 25, 2023
Iman Ilhusadi
Nov 26, 2016
Jaydeepa Das
Aug 21, 2018
Atefeh Abdollahi
Jan 3, 2017

Featured Articles

Trending Articles

Watch Articles

- Terms of Use
- Privacy Policy
- Do Not Sell or Share My Info
- Not Selling Info
wikiHow Tech Help Pro:
Level up your tech skills and stay ahead of the curve
Designing a Questionnaire for a Research Paper: A Comprehensive Guide to Design and Develop an Effective Questionnaire
Taherdoost, H. (2022). Designing a Questionnaire for a Research Paper: A Comprehensive Guide to Design and Develop an Effective Questionnaire, Asian Journal of Managerial Science, 11(1): 8-16. DOI: https://doi.org/10.51983/ajms-2022.11.1.3087
Posted: 5 Dec 2022
Hamed Taherdoost
Hamta Group
Date Written: August 1, 2022
A questionnaire is an important instrument in a research study to help the researcher collect relevant data regarding the research topic. It is significant to ensure that the design of the questionnaire is arranged to minimize errors. However, researchers commonly face challenges in designing an effective questionnaire including its content, appearance and usage that leads to inappropriate and biased findings in a study. This paper aims to review the main steps to design a questionnaire introducing the process that starts with defining the information required for a study, then continues with the identification of the type of survey and types of questions, writing questions and building the construct of the questionnaire. It also develops the demand to pre-test the questionnaire and finalizing the questionnaire to conduct the survey.
Keywords: Questionnaire, Academic Survey, Questionnaire Design, Research Methodology
Suggested Citation: Suggested Citation
Hamed Taherdoost (Contact Author)
Hamta group ( email ).
Vancouver Canada
Do you have a job opening that you would like to promote on SSRN?
Paper statistics, related ejournals, social sciences education ejournal.
Subscribe to this fee journal for more curated articles on this topic
Libraries & Media eJournal
Academia.edu no longer supports Internet Explorer.
To browse Academia.edu and the wider internet faster and more securely, please take a few seconds to upgrade your browser .
Enter the email address you signed up with and we'll email you a reset link.
- We're Hiring!
- Help Center

Designing a Questionnaire for a Research Paper: A Comprehensive Guide to Design and Develop an Effective Questionnaire

A questionnaire is an important instrument in a research study to help the researcher collect relevant data regarding the research topic. It is significant to ensure that the design of the questionnaire is arranged to minimize errors. However, researchers commonly face challenges in designing an effective questionnaire including its content, appearance and usage that leads to inappropriate and biased findings in a study. This paper aims to review the main steps to design a questionnaire introducing the process that starts with defining the information required for a study, then continues with the identification of the type of survey and types of questions, writing questions and building the construct of the questionnaire. It also develops the demand to pre-test the questionnaire and finalizing the questionnaire to conduct the survey.
Related Papers
Innovations in Measuring and Evaluating Scientific Information
Rayees Farooq
Indian Journal of Anaesthesia
Narayana Yaddanapudi
Edrine Wanyama
Questionnaire construction has overtime evolved with consistency and rarely, it has been skipped in the world’s researches. Questionnaires form the basis for which most pieces of information can be obtained. In the very light, response rates to questions and accuracy of data findings are possible through the use of questionnaire usage. Where a questionnaire is poorly constructed, one faces the risk of missing out vital information which could be forming the basis for research. This paper discusses the relevance and importance of questionnaire construction in data collection and research. An attempt is made to show questionnaire usage in social research and other research processes. Ultimately, questionnaire construction is considered just as important as any other research process used while collecting data. Some key recommendations that could make questionnaire usage in research better are also briefly considered.
Trisha Greenhalgh
Abla BENBELLAL
International Dental & Medical Journal of Advanced Research - VOLUME 2015
Saumya Dubey
Ebenezer Consultan
International Journal of Market Research
Petra Lietz
Some consider responding to survey questions as a sophisticated cognitive process whereby respondents go through, often iterative, steps to process the information provided to them by questions and response options. Others focus more on the interplay between questions and answers as a complex communication process between researchers and respondents, their assumptions, expectations and perceptions. In this article, cognitive and communication research is reviewed that has tested the impact of different question and answer alternatives on the responses obtained. This leads to evidence-based recommendations for market researchers, who frequently have to make decisions regarding various aspects of questionnaire design such as question length and order, question wording, as well as the optimal number of response options and the desirability or otherwise of a ‘don't know’ option or a middle alternative.
Journal of Family Planning and Reproductive Health Care
Gill Wakley
Daniela Garcia
Loading Preview
Sorry, preview is currently unavailable. You can download the paper by clicking the button above.
RELATED PAPERS
De Wet Schutte
Lyberg/Survey
Norbert Schwarz
International Statistical Review
massimo borelli
Health Information & Libraries Journal
Andrew Booth
Nursing Times Research
michael kirk-smith
Petra Boynton
Market Research Society. Journal.
Zenodo (CERN European Organization for Nuclear Research)
Mohamad Adam Bujang
Medical Teacher
Anthony Artino
Jiayi Zhang
Sallie Newell
Health technology assessment (Winchester, England)
Lois Thomas , Claire Bamford , E. McColl
Burcu Akhun
International Journal of Assessment Tools in Education
Betty Adams
Jason Harlacher
Clinical Nurse Specialist
Sandra Siedlecki
Otolaryngology–Head and Neck Surgery
Randal Paniello
Nipuni Rangika
André Pereira
Biometrics & Biostatistics International Journal
Prof. Dr. İlker Etikan
International Journal of Management, Technology, and Social Sciences (IJMTS)
Srinivas Publication , Sreeramana Aithal
Zurina Saaya
Amanda Hunn
Anco Hundepool
RELATED TOPICS
- We're Hiring!
- Help Center
- Find new research papers in:
- Health Sciences
- Earth Sciences
- Cognitive Science
- Mathematics
- Computer Science
- Academia ©2024
- Skip to main content
- Skip to primary sidebar
- Skip to footer
- QuestionPro

- Solutions Industries Gaming Automotive Sports and events Education Government Travel & Hospitality Financial Services Healthcare Cannabis Technology Use Case NPS+ Communities Audience Contactless surveys Mobile LivePolls Member Experience GDPR Positive People Science 360 Feedback Surveys
- Resources Blog eBooks Survey Templates Case Studies Training Help center
Home Surveys Questionnaire
21 Questionnaire Templates: Examples and Samples

Questionnaire: Definition
A questionnaire is defined a market research instrument that consists of questions or prompts to elicit and collect responses from a sample of respondents. A questionnaire is typically a mix of open-ended questions and close-ended questions ; the latter allowing for respondents to enlist their views in detail.
A questionnaire can be used in both, qualitative market research as well as quantitative market research with the use of different types of questions .
LEARN ABOUT: Open-Ended Questions
Types of Questionnaires
We have learnt that a questionnaire could either be structured or free-flow. To explain this better:
- Structured Questionnaires: A structured questionnaires helps collect quantitative data . In this case, the questionnaire is designed in a way that it collects very specific type of information. It can be used to initiate a formal enquiry on collect data to prove or disprove a prior hypothesis.
- Unstructured Questionnaires: An unstructured questionnaire collects qualitative data . The questionnaire in this case has a basic structure and some branching questions but nothing that limits the responses of a respondent. The questions are more open-ended.
LEARN ABOUT: Structured Question
Types of Questions used in a Questionnaire
A questionnaire can consist of many types of questions . Some of the commonly and widely used question types though, are:
- Open-Ended Questions: One of the commonly used question type in questionnaire is an open-ended question . These questions help collect in-depth data from a respondent as there is a huge scope to respond in detail.
- Dichotomous Questions: The dichotomous question is a “yes/no” close-ended question . This question is generally used in case of the need of basic validation. It is the easiest question type in a questionnaire.
- Multiple-Choice Questions: An easy to administer and respond to, question type in a questionnaire is the multiple-choice question . These questions are close-ended questions with either a single select multiple choice question or a multiple select multiple choice question. Each multiple choice question consists of an incomplete stem (question), right answer or answers, close alternatives, distractors and incorrect answers. Depending on the objective of the research, a mix of the above option types can be used.
- Net Promoter Score (NPS) Question: Another commonly used question type in a questionnaire is the Net Promoter Score (NPS) Question where one single question collects data on the referencability of the research topic in question.
- Scaling Questions: Scaling questions are widely used in a questionnaire as they make responding to the questionnaire, very easy. These questions are based on the principles of the 4 measurement scales – nominal, ordinal, interval and ratio .
Questionnaires help enterprises collect valuable data to help them make well-informed business decisions. There are powerful tools available in the market that allows using multiple question types, ready to use survey format templates, robust analytics, and many more features to conduct comprehensive market research.
LEARN ABOUT: course evaluation survey examples
For example, an enterprise wants to conduct market research to understand what pricing would be best for their new product to capture a higher market share. In such a case, a questionnaire for competitor analysis can be sent to the targeted audience using a powerful market research survey software which can help the enterprise conduct 360 market research that will enable them to make strategic business decisions.
Now that we have learned what a questionnaire is and its use in market research , some examples and samples of widely used questionnaire templates on the QuestionPro platform are as below:
LEARN ABOUT: Speaker evaluation form
Customer Questionnaire Templates: Examples and Samples
QuestionPro specializes in end-to-end Customer Questionnaire Templates that can be used to evaluate a customer journey right from indulging with a brand to the continued use and referenceability of the brand. These templates form excellent samples to form your own questionnaire and begin testing your customer satisfaction and experience based on customer feedback.
LEARN ABOUT: Structured Questionnaire
USE THIS FREE TEMPLATE
Employee & Human Resource (HR) Questionnaire Templates: Examples and Samples
QuestionPro has built a huge repository of employee questionnaires and HR questionnaires that can be readily deployed to collect feedback from the workforce on an organization on multiple parameters like employee satisfaction, benefits evaluation, manager evaluation , exit formalities etc. These templates provide a holistic overview of collecting actionable data from employees.
Community Questionnaire Templates: Examples and Samples
The QuestionPro repository of community questionnaires helps collect varied data on all community aspects. This template library includes popular questionnaires such as community service, demographic questionnaires, psychographic questionnaires, personal questionnaires and much more.
Academic Evaluation Questionnaire Templates: Examples and Samples
Another vastly used section of QuestionPro questionnaire templates are the academic evaluation questionnaires . These questionnaires are crafted to collect in-depth data about academic institutions and the quality of teaching provided, extra-curricular activities etc and also feedback about other educational activities.
MORE LIKE THIS

Qualtrics vs Google Forms: Which is the Best Platform?
Jul 24, 2024

TypeForm vs. SurveyMonkey: Which is Better in 2024?

SurveyMonkey vs Google Forms: A Detailed Comparison
Jul 23, 2024

Jotform vs Typeform: Which is the Best Option? Comparison (2024)
Other categories.
- Academic Research
- Artificial Intelligence
- Assessments
- Brand Awareness
- Case Studies
- Communities
- Consumer Insights
- Customer effort score
- Customer Engagement
- Customer Experience
- Customer Loyalty
- Customer Research
- Customer Satisfaction
- Employee Benefits
- Employee Engagement
- Employee Retention
- Friday Five
- General Data Protection Regulation
- Insights Hub
- Life@QuestionPro
- Market Research
- Mobile diaries
- Mobile Surveys
- New Features
- Online Communities
- Question Types
- Questionnaire
- QuestionPro Products
- Release Notes
- Research Tools and Apps
- Revenue at Risk
- Survey Templates
- Training Tips
- Tuesday CX Thoughts (TCXT)
- Uncategorized
- What’s Coming Up
- Workforce Intelligence
- Utility Menu
Harvard University Program on Survey Research
- Questionnaire Design Tip Sheet
This PSR Tip Sheet provides some basic tips about how to write good survey questions and design a good survey questionnaire.
| 40 KB |
PSR Resources
- Managing and Manipulating Survey Data: A Beginners Guide
- Finding and Hiring Survey Contractors
- How to Frame and Explain the Survey Data Used in a Thesis
- Overview of Cognitive Testing and Questionnaire Evaluation
- Sampling, Coverage, and Nonresponse Tip Sheet
- Introduction to Surveys for Honors Thesis Writers
- PSR Introduction to the Survey Process
- Related Centers/Programs at Harvard
- General Survey Reference
- Institutional Review Boards
- Select Funding Opportunities
- Survey Analysis Software
- Professional Standards
- Professional Organizations
- Major Public Polls
- Survey Data Collections
- Major Longitudinal Surveys
- Other Links
- DOI: 10.51983/ajms-2022.11.1.3087
- Corpus ID: 248486251
Designing a Questionnaire for a Research Paper: A Comprehensive Guide to Design and Develop an Effective Questionnaire
- Hamed Taherdoost
- Published in Asian Journal of Management… 25 April 2022
Figures and Tables from this paper

18 Citations
Qsnail: a questionnaire dataset for sequential question generation, factors of old vehicle emissions in urban areas.
- Highly Influenced
Development of STEM-based Science E-Module on the Human Excretory System Topic
Socio-cultural factors and women’s representation in political leadership: case study mbale city councils, the implementation of using numbered head together (nht) learning model to improve students’ speaking achievement, the impact of teacher’s feedback on students’ writing ability, drivers for clustering and inter-project collaboration—a case of horizon europe projects, strategic management practices as fundamental to the achievement of organizational performances, validity and reliability of the pfizer booster vaccine effectiveness questionnaire, development of science learning e-module with online media on water pollution matter in lake tondano, 50 references, questionnaire design: how to plan, structure and write survey material for effective market research.
- Highly Influential
How to Design and Create an Effective Survey/Questionnaire; A Step by Step Guide
Methodological issues in questionnaire design., research into questionnaire design: a summary of the literature, questionnaire design and scale development, questionnaire design., ethical issues in surveys, the palgrave handbook of survey research.
- 10 Excerpts
The Handbook of Marketing Research: Uses, Misuses, and Future Advances
Questionnaire design: asking questions with a purpose, related papers.
Showing 1 through 3 of 0 Related Papers
Have a language expert improve your writing
Run a free plagiarism check in 10 minutes, generate accurate citations for free.
- Knowledge Base
Methodology
- Survey Research | Definition, Examples & Methods
Survey Research | Definition, Examples & Methods
Published on August 20, 2019 by Shona McCombes . Revised on June 22, 2023.
Survey research means collecting information about a group of people by asking them questions and analyzing the results. To conduct an effective survey, follow these six steps:
- Determine who will participate in the survey
- Decide the type of survey (mail, online, or in-person)
- Design the survey questions and layout
- Distribute the survey
- Analyze the responses
- Write up the results
Surveys are a flexible method of data collection that can be used in many different types of research .
Table of contents
What are surveys used for, step 1: define the population and sample, step 2: decide on the type of survey, step 3: design the survey questions, step 4: distribute the survey and collect responses, step 5: analyze the survey results, step 6: write up the survey results, other interesting articles, frequently asked questions about surveys.
Surveys are used as a method of gathering data in many different fields. They are a good choice when you want to find out about the characteristics, preferences, opinions, or beliefs of a group of people.
Common uses of survey research include:
- Social research : investigating the experiences and characteristics of different social groups
- Market research : finding out what customers think about products, services, and companies
- Health research : collecting data from patients about symptoms and treatments
- Politics : measuring public opinion about parties and policies
- Psychology : researching personality traits, preferences and behaviours
Surveys can be used in both cross-sectional studies , where you collect data just once, and in longitudinal studies , where you survey the same sample several times over an extended period.
Receive feedback on language, structure, and formatting
Professional editors proofread and edit your paper by focusing on:
- Academic style
- Vague sentences
- Style consistency
See an example

Before you start conducting survey research, you should already have a clear research question that defines what you want to find out. Based on this question, you need to determine exactly who you will target to participate in the survey.
Populations
The target population is the specific group of people that you want to find out about. This group can be very broad or relatively narrow. For example:
- The population of Brazil
- US college students
- Second-generation immigrants in the Netherlands
- Customers of a specific company aged 18-24
- British transgender women over the age of 50
Your survey should aim to produce results that can be generalized to the whole population. That means you need to carefully define exactly who you want to draw conclusions about.
Several common research biases can arise if your survey is not generalizable, particularly sampling bias and selection bias . The presence of these biases have serious repercussions for the validity of your results.
It’s rarely possible to survey the entire population of your research – it would be very difficult to get a response from every person in Brazil or every college student in the US. Instead, you will usually survey a sample from the population.
The sample size depends on how big the population is. You can use an online sample calculator to work out how many responses you need.
There are many sampling methods that allow you to generalize to broad populations. In general, though, the sample should aim to be representative of the population as a whole. The larger and more representative your sample, the more valid your conclusions. Again, beware of various types of sampling bias as you design your sample, particularly self-selection bias , nonresponse bias , undercoverage bias , and survivorship bias .
There are two main types of survey:
- A questionnaire , where a list of questions is distributed by mail, online or in person, and respondents fill it out themselves.
- An interview , where the researcher asks a set of questions by phone or in person and records the responses.
Which type you choose depends on the sample size and location, as well as the focus of the research.
Questionnaires
Sending out a paper survey by mail is a common method of gathering demographic information (for example, in a government census of the population).
- You can easily access a large sample.
- You have some control over who is included in the sample (e.g. residents of a specific region).
- The response rate is often low, and at risk for biases like self-selection bias .
Online surveys are a popular choice for students doing dissertation research , due to the low cost and flexibility of this method. There are many online tools available for constructing surveys, such as SurveyMonkey and Google Forms .
- You can quickly access a large sample without constraints on time or location.
- The data is easy to process and analyze.
- The anonymity and accessibility of online surveys mean you have less control over who responds, which can lead to biases like self-selection bias .
If your research focuses on a specific location, you can distribute a written questionnaire to be completed by respondents on the spot. For example, you could approach the customers of a shopping mall or ask all students to complete a questionnaire at the end of a class.
- You can screen respondents to make sure only people in the target population are included in the sample.
- You can collect time- and location-specific data (e.g. the opinions of a store’s weekday customers).
- The sample size will be smaller, so this method is less suitable for collecting data on broad populations and is at risk for sampling bias .
Oral interviews are a useful method for smaller sample sizes. They allow you to gather more in-depth information on people’s opinions and preferences. You can conduct interviews by phone or in person.
- You have personal contact with respondents, so you know exactly who will be included in the sample in advance.
- You can clarify questions and ask for follow-up information when necessary.
- The lack of anonymity may cause respondents to answer less honestly, and there is more risk of researcher bias.
Like questionnaires, interviews can be used to collect quantitative data: the researcher records each response as a category or rating and statistically analyzes the results. But they are more commonly used to collect qualitative data : the interviewees’ full responses are transcribed and analyzed individually to gain a richer understanding of their opinions and feelings.
Next, you need to decide which questions you will ask and how you will ask them. It’s important to consider:
- The type of questions
- The content of the questions
- The phrasing of the questions
- The ordering and layout of the survey
Open-ended vs closed-ended questions
There are two main forms of survey questions: open-ended and closed-ended. Many surveys use a combination of both.
Closed-ended questions give the respondent a predetermined set of answers to choose from. A closed-ended question can include:
- A binary answer (e.g. yes/no or agree/disagree )
- A scale (e.g. a Likert scale with five points ranging from strongly agree to strongly disagree )
- A list of options with a single answer possible (e.g. age categories)
- A list of options with multiple answers possible (e.g. leisure interests)
Closed-ended questions are best for quantitative research . They provide you with numerical data that can be statistically analyzed to find patterns, trends, and correlations .
Open-ended questions are best for qualitative research. This type of question has no predetermined answers to choose from. Instead, the respondent answers in their own words.
Open questions are most common in interviews, but you can also use them in questionnaires. They are often useful as follow-up questions to ask for more detailed explanations of responses to the closed questions.
The content of the survey questions
To ensure the validity and reliability of your results, you need to carefully consider each question in the survey. All questions should be narrowly focused with enough context for the respondent to answer accurately. Avoid questions that are not directly relevant to the survey’s purpose.
When constructing closed-ended questions, ensure that the options cover all possibilities. If you include a list of options that isn’t exhaustive, you can add an “other” field.
Phrasing the survey questions
In terms of language, the survey questions should be as clear and precise as possible. Tailor the questions to your target population, keeping in mind their level of knowledge of the topic. Avoid jargon or industry-specific terminology.
Survey questions are at risk for biases like social desirability bias , the Hawthorne effect , or demand characteristics . It’s critical to use language that respondents will easily understand, and avoid words with vague or ambiguous meanings. Make sure your questions are phrased neutrally, with no indication that you’d prefer a particular answer or emotion.
Ordering the survey questions
The questions should be arranged in a logical order. Start with easy, non-sensitive, closed-ended questions that will encourage the respondent to continue.
If the survey covers several different topics or themes, group together related questions. You can divide a questionnaire into sections to help respondents understand what is being asked in each part.
If a question refers back to or depends on the answer to a previous question, they should be placed directly next to one another.
Before you start, create a clear plan for where, when, how, and with whom you will conduct the survey. Determine in advance how many responses you require and how you will gain access to the sample.
When you are satisfied that you have created a strong research design suitable for answering your research questions, you can conduct the survey through your method of choice – by mail, online, or in person.
There are many methods of analyzing the results of your survey. First you have to process the data, usually with the help of a computer program to sort all the responses. You should also clean the data by removing incomplete or incorrectly completed responses.
If you asked open-ended questions, you will have to code the responses by assigning labels to each response and organizing them into categories or themes. You can also use more qualitative methods, such as thematic analysis , which is especially suitable for analyzing interviews.
Statistical analysis is usually conducted using programs like SPSS or Stata. The same set of survey data can be subject to many analyses.
Finally, when you have collected and analyzed all the necessary data, you will write it up as part of your thesis, dissertation , or research paper .
In the methodology section, you describe exactly how you conducted the survey. You should explain the types of questions you used, the sampling method, when and where the survey took place, and the response rate. You can include the full questionnaire as an appendix and refer to it in the text if relevant.
Then introduce the analysis by describing how you prepared the data and the statistical methods you used to analyze it. In the results section, you summarize the key results from your analysis.
In the discussion and conclusion , you give your explanations and interpretations of these results, answer your research question, and reflect on the implications and limitations of the research.
If you want to know more about statistics , methodology , or research bias , make sure to check out some of our other articles with explanations and examples.
- Student’s t -distribution
- Normal distribution
- Null and Alternative Hypotheses
- Chi square tests
- Confidence interval
- Quartiles & Quantiles
- Cluster sampling
- Stratified sampling
- Data cleansing
- Reproducibility vs Replicability
- Peer review
- Prospective cohort study
Research bias
- Implicit bias
- Cognitive bias
- Placebo effect
- Hawthorne effect
- Hindsight bias
- Affect heuristic
- Social desirability bias
A questionnaire is a data collection tool or instrument, while a survey is an overarching research method that involves collecting and analyzing data from people using questionnaires.
A Likert scale is a rating scale that quantitatively assesses opinions, attitudes, or behaviors. It is made up of 4 or more questions that measure a single attitude or trait when response scores are combined.
To use a Likert scale in a survey , you present participants with Likert-type questions or statements, and a continuum of items, usually with 5 or 7 possible responses, to capture their degree of agreement.
Individual Likert-type questions are generally considered ordinal data , because the items have clear rank order, but don’t have an even distribution.
Overall Likert scale scores are sometimes treated as interval data. These scores are considered to have directionality and even spacing between them.
The type of data determines what statistical tests you should use to analyze your data.
The priorities of a research design can vary depending on the field, but you usually have to specify:
- Your research questions and/or hypotheses
- Your overall approach (e.g., qualitative or quantitative )
- The type of design you’re using (e.g., a survey , experiment , or case study )
- Your sampling methods or criteria for selecting subjects
- Your data collection methods (e.g., questionnaires , observations)
- Your data collection procedures (e.g., operationalization , timing and data management)
- Your data analysis methods (e.g., statistical tests or thematic analysis )
Cite this Scribbr article
If you want to cite this source, you can copy and paste the citation or click the “Cite this Scribbr article” button to automatically add the citation to our free Citation Generator.
McCombes, S. (2023, June 22). Survey Research | Definition, Examples & Methods. Scribbr. Retrieved July 27, 2024, from https://www.scribbr.com/methodology/survey-research/
Is this article helpful?

Shona McCombes
Other students also liked, qualitative vs. quantitative research | differences, examples & methods, questionnaire design | methods, question types & examples, what is a likert scale | guide & examples, what is your plagiarism score.
How to Write a Research Proposal: (with Examples & Templates)

Table of Contents
Before conducting a study, a research proposal should be created that outlines researchers’ plans and methodology and is submitted to the concerned evaluating organization or person. Creating a research proposal is an important step to ensure that researchers are on track and are moving forward as intended. A research proposal can be defined as a detailed plan or blueprint for the proposed research that you intend to undertake. It provides readers with a snapshot of your project by describing what you will investigate, why it is needed, and how you will conduct the research.
Your research proposal should aim to explain to the readers why your research is relevant and original, that you understand the context and current scenario in the field, have the appropriate resources to conduct the research, and that the research is feasible given the usual constraints.
This article will describe in detail the purpose and typical structure of a research proposal , along with examples and templates to help you ace this step in your research journey.
What is a Research Proposal ?
A research proposal¹ ,² can be defined as a formal report that describes your proposed research, its objectives, methodology, implications, and other important details. Research proposals are the framework of your research and are used to obtain approvals or grants to conduct the study from various committees or organizations. Consequently, research proposals should convince readers of your study’s credibility, accuracy, achievability, practicality, and reproducibility.
With research proposals , researchers usually aim to persuade the readers, funding agencies, educational institutions, and supervisors to approve the proposal. To achieve this, the report should be well structured with the objectives written in clear, understandable language devoid of jargon. A well-organized research proposal conveys to the readers or evaluators that the writer has thought out the research plan meticulously and has the resources to ensure timely completion.
Purpose of Research Proposals
A research proposal is a sales pitch and therefore should be detailed enough to convince your readers, who could be supervisors, ethics committees, universities, etc., that what you’re proposing has merit and is feasible . Research proposals can help students discuss their dissertation with their faculty or fulfill course requirements and also help researchers obtain funding. A well-structured proposal instills confidence among readers about your ability to conduct and complete the study as proposed.
Research proposals can be written for several reasons:³
- To describe the importance of research in the specific topic
- Address any potential challenges you may encounter
- Showcase knowledge in the field and your ability to conduct a study
- Apply for a role at a research institute
- Convince a research supervisor or university that your research can satisfy the requirements of a degree program
- Highlight the importance of your research to organizations that may sponsor your project
- Identify implications of your project and how it can benefit the audience
What Goes in a Research Proposal?
Research proposals should aim to answer the three basic questions—what, why, and how.
The What question should be answered by describing the specific subject being researched. It should typically include the objectives, the cohort details, and the location or setting.
The Why question should be answered by describing the existing scenario of the subject, listing unanswered questions, identifying gaps in the existing research, and describing how your study can address these gaps, along with the implications and significance.
The How question should be answered by describing the proposed research methodology, data analysis tools expected to be used, and other details to describe your proposed methodology.
Research Proposal Example
Here is a research proposal sample template (with examples) from the University of Rochester Medical Center. 4 The sections in all research proposals are essentially the same although different terminology and other specific sections may be used depending on the subject.

Structure of a Research Proposal
If you want to know how to make a research proposal impactful, include the following components:¹
1. Introduction
This section provides a background of the study, including the research topic, what is already known about it and the gaps, and the significance of the proposed research.
2. Literature review
This section contains descriptions of all the previous relevant studies pertaining to the research topic. Every study cited should be described in a few sentences, starting with the general studies to the more specific ones. This section builds on the understanding gained by readers in the Introduction section and supports it by citing relevant prior literature, indicating to readers that you have thoroughly researched your subject.
3. Objectives
Once the background and gaps in the research topic have been established, authors must now state the aims of the research clearly. Hypotheses should be mentioned here. This section further helps readers understand what your study’s specific goals are.
4. Research design and methodology
Here, authors should clearly describe the methods they intend to use to achieve their proposed objectives. Important components of this section include the population and sample size, data collection and analysis methods and duration, statistical analysis software, measures to avoid bias (randomization, blinding), etc.
5. Ethical considerations
This refers to the protection of participants’ rights, such as the right to privacy, right to confidentiality, etc. Researchers need to obtain informed consent and institutional review approval by the required authorities and mention this clearly for transparency.
6. Budget/funding
Researchers should prepare their budget and include all expected expenditures. An additional allowance for contingencies such as delays should also be factored in.
7. Appendices
This section typically includes information that supports the research proposal and may include informed consent forms, questionnaires, participant information, measurement tools, etc.
8. Citations

Important Tips for Writing a Research Proposal
Writing a research proposal begins much before the actual task of writing. Planning the research proposal structure and content is an important stage, which if done efficiently, can help you seamlessly transition into the writing stage. 3,5
The Planning Stage
- Manage your time efficiently. Plan to have the draft version ready at least two weeks before your deadline and the final version at least two to three days before the deadline.
- What is the primary objective of your research?
- Will your research address any existing gap?
- What is the impact of your proposed research?
- Do people outside your field find your research applicable in other areas?
- If your research is unsuccessful, would there still be other useful research outcomes?
The Writing Stage
- Create an outline with main section headings that are typically used.
- Focus only on writing and getting your points across without worrying about the format of the research proposal , grammar, punctuation, etc. These can be fixed during the subsequent passes. Add details to each section heading you created in the beginning.
- Ensure your sentences are concise and use plain language. A research proposal usually contains about 2,000 to 4,000 words or four to seven pages.
- Don’t use too many technical terms and abbreviations assuming that the readers would know them. Define the abbreviations and technical terms.
- Ensure that the entire content is readable. Avoid using long paragraphs because they affect the continuity in reading. Break them into shorter paragraphs and introduce some white space for readability.
- Focus on only the major research issues and cite sources accordingly. Don’t include generic information or their sources in the literature review.
- Proofread your final document to ensure there are no grammatical errors so readers can enjoy a seamless, uninterrupted read.
- Use academic, scholarly language because it brings formality into a document.
- Ensure that your title is created using the keywords in the document and is neither too long and specific nor too short and general.
- Cite all sources appropriately to avoid plagiarism.
- Make sure that you follow guidelines, if provided. This includes rules as simple as using a specific font or a hyphen or en dash between numerical ranges.
- Ensure that you’ve answered all questions requested by the evaluating authority.
Key Takeaways
Here’s a summary of the main points about research proposals discussed in the previous sections:
- A research proposal is a document that outlines the details of a proposed study and is created by researchers to submit to evaluators who could be research institutions, universities, faculty, etc.
- Research proposals are usually about 2,000-4,000 words long, but this depends on the evaluating authority’s guidelines.
- A good research proposal ensures that you’ve done your background research and assessed the feasibility of the research.
- Research proposals have the following main sections—introduction, literature review, objectives, methodology, ethical considerations, and budget.

Frequently Asked Questions
Q1. How is a research proposal evaluated?
A1. In general, most evaluators, including universities, broadly use the following criteria to evaluate research proposals . 6
- Significance —Does the research address any important subject or issue, which may or may not be specific to the evaluator or university?
- Content and design —Is the proposed methodology appropriate to answer the research question? Are the objectives clear and well aligned with the proposed methodology?
- Sample size and selection —Is the target population or cohort size clearly mentioned? Is the sampling process used to select participants randomized, appropriate, and free of bias?
- Timing —Are the proposed data collection dates mentioned clearly? Is the project feasible given the specified resources and timeline?
- Data management and dissemination —Who will have access to the data? What is the plan for data analysis?
Q2. What is the difference between the Introduction and Literature Review sections in a research proposal ?
A2. The Introduction or Background section in a research proposal sets the context of the study by describing the current scenario of the subject and identifying the gaps and need for the research. A Literature Review, on the other hand, provides references to all prior relevant literature to help corroborate the gaps identified and the research need.
Q3. How long should a research proposal be?
A3. Research proposal lengths vary with the evaluating authority like universities or committees and also the subject. Here’s a table that lists the typical research proposal lengths for a few universities.
| Arts programs | 1,000-1,500 | |
| University of Birmingham | Law School programs | 2,500 |
| PhD | 2,500 | |
| 2,000 | ||
| Research degrees | 2,000-3,500 |
Q4. What are the common mistakes to avoid in a research proposal ?
A4. Here are a few common mistakes that you must avoid while writing a research proposal . 7
- No clear objectives: Objectives should be clear, specific, and measurable for the easy understanding among readers.
- Incomplete or unconvincing background research: Background research usually includes a review of the current scenario of the particular industry and also a review of the previous literature on the subject. This helps readers understand your reasons for undertaking this research because you identified gaps in the existing research.
- Overlooking project feasibility: The project scope and estimates should be realistic considering the resources and time available.
- Neglecting the impact and significance of the study: In a research proposal , readers and evaluators look for the implications or significance of your research and how it contributes to the existing research. This information should always be included.
- Unstructured format of a research proposal : A well-structured document gives confidence to evaluators that you have read the guidelines carefully and are well organized in your approach, consequently affirming that you will be able to undertake the research as mentioned in your proposal.
- Ineffective writing style: The language used should be formal and grammatically correct. If required, editors could be consulted, including AI-based tools such as Paperpal , to refine the research proposal structure and language.
Thus, a research proposal is an essential document that can help you promote your research and secure funds and grants for conducting your research. Consequently, it should be well written in clear language and include all essential details to convince the evaluators of your ability to conduct the research as proposed.
This article has described all the important components of a research proposal and has also provided tips to improve your writing style. We hope all these tips will help you write a well-structured research proposal to ensure receipt of grants or any other purpose.
References
- Sudheesh K, Duggappa DR, Nethra SS. How to write a research proposal? Indian J Anaesth. 2016;60(9):631-634. Accessed July 15, 2024. https://www.ncbi.nlm.nih.gov/pmc/articles/PMC5037942/
- Writing research proposals. Harvard College Office of Undergraduate Research and Fellowships. Harvard University. Accessed July 14, 2024. https://uraf.harvard.edu/apply-opportunities/app-components/essays/research-proposals
- What is a research proposal? Plus how to write one. Indeed website. Accessed July 17, 2024. https://www.indeed.com/career-advice/career-development/research-proposal
- Research proposal template. University of Rochester Medical Center. Accessed July 16, 2024. https://www.urmc.rochester.edu/MediaLibraries/URMCMedia/pediatrics/research/documents/Research-proposal-Template.pdf
- Tips for successful proposal writing. Johns Hopkins University. Accessed July 17, 2024. https://research.jhu.edu/wp-content/uploads/2018/09/Tips-for-Successful-Proposal-Writing.pdf
- Formal review of research proposals. Cornell University. Accessed July 18, 2024. https://irp.dpb.cornell.edu/surveys/survey-assessment-review-group/research-proposals
- 7 Mistakes you must avoid in your research proposal. Aveksana (via LinkedIn). Accessed July 17, 2024. https://www.linkedin.com/pulse/7-mistakes-you-must-avoid-your-research-proposal-aveksana-cmtwf/
Paperpal is a comprehensive AI writing toolkit that helps students and researchers achieve 2x the writing in half the time. It leverages 21+ years of STM experience and insights from millions of research articles to provide in-depth academic writing, language editing, and submission readiness support to help you write better, faster.
Get accurate academic translations, rewriting support, grammar checks, vocabulary suggestions, and generative AI assistance that delivers human precision at machine speed. Try for free or upgrade to Paperpal Prime starting at US$19 a month to access premium features, including consistency, plagiarism, and 30+ submission readiness checks to help you succeed.
Experience the future of academic writing – Sign up to Paperpal and start writing for free!
Related Reads:
- How to Paraphrase Research Papers Effectively
- How to Cite Social Media Sources in Academic Writing?
- What is the Importance of a Concept Paper and How to Write It
APA format: Basic Guide for Researchers
You may also like, how to choose a dissertation topic, how to write a phd research proposal, how to write an academic paragraph (step-by-step guide), five things authors need to know when using..., 7 best referencing tools and citation management software..., maintaining academic integrity with paperpal’s generative ai writing..., research funding basics: what should a grant proposal..., how to write an abstract in research papers..., how to write dissertation acknowledgements.
- Election 2024
- Entertainment
- Newsletters
- Photography
- AP Buyline Personal Finance
- AP Buyline Shopping
- Press Releases
- Israel-Hamas War
- Russia-Ukraine War
- Global elections
- Asia Pacific
- Latin America
- Middle East
- Election Results
- Delegate Tracker
- AP & Elections
- 2024 Paris Olympic Games
- Auto Racing
- Movie reviews
- Book reviews
- Financial Markets
- Business Highlights
- Financial wellness
- Artificial Intelligence
- Social Media
Noncitizens are less likely to participate in a census with citizenship question, study says
FILE - A woman fills out a pledge card for the U.S. Census in exchange for a reusable boba tea carton at a boba drink competition in Phoenix on Jan. 3, 2020. According to a new study released in June 2024, adding a citizenship question to the census reduces the participation of people who aren’t U.S. citizens. (AP Photo/Terry Tang, File)

- Copy Link copied
Adding a citizenship question to the census reduces the participation of people who aren’t U.S. citizens, particularly those from Latin American countries, according to a new research paper that comes as Republicans in Congress are pushing to add such a question to the census form.
Noncitizens who pay taxes but are ineligible to have a Social Security number are less likely to fill out the census questionnaire or more likely to give incomplete answers on the form if there is a citizenship question, potentially exacerbating undercounts of some groups, according to the paper released this summer by researchers at the U.S. Census Bureau and the University of Kansas.
Other groups were less sensitive to the addition of a citizenship question, such as U.S.-born Hispanic residents and noncitizens who weren’t from Latin America, the study said.
The paper comes as Republican lawmakers in Congress push to require a citizenship question on the questionnaire for the once-a-decade census. Their aim is to exclude people who aren’t citizens from the count that helps determine political power and the distribution of federal funds in the United States. The 14th Amendment requires that all people are counted in the census, not just citizens.
In May, the GOP-led House passed a bill that would eliminate noncitizens from the tally gathered during a census and used to decide how many House seats and Electoral College votes each state gets. The bill is unlikely to pass the Democratic-controlled Senate. Separately, the House in coming weeks is to consider an appropriations bill containing similar language seeking to omit people in the country illegally from the count used to redraw political districts .
During debate earlier this month at a House appropriations committee meeting, Democratic U.S. Rep. Grace Meng of New York described the efforts to exclude people in the country illegally as “an extreme proposal” that would detract from the accuracy of the census.
“Pretending that noncitizens don’t live in our communities would only limit the crucial work of the Census Bureau and take resources away from areas that need them the most,” Meng said.
But Republican U.S. Rep. Andrew Clyde of Georgia argued that including people in the country illegally gives state and local governments an incentive to attract noncitizens so that they can have bigger populations and more political power.
“Every noncitizen that is included actually takes away from citizens’ ability to determine who their representatives are,” Clyde said.
The next national head count is in 2030.
In their paper, the Census Bureau and Kansas researchers revisited a study assessing the impact of a citizenship question on a 2019 trial survey that was conducted by the Census Bureau ahead of the 2020 census.
The trial survey was conducted by the Census Bureau as the Trump administration unsuccessfully attempted to add a citizenship question to the 2020 head count’s questionnaire. Experts feared a citizenship question would scare off Hispanics and immigrants from participating in the 2020 census, whether they were in the country legally or not. Years earlier, a Republican redistricting expert had written that using citizen voting-age population instead of the total population for the purpose of redrawing of congressional and legislative districts could be advantageous to Republicans and non-Hispanic whites.
The citizenship question was blocked by the Supreme Court in 2019.
As part of the trial survey, test questionnaires were sent by the Census Bureau to 480,000 households across the U.S. Half of the questionnaires had a citizenship question and the other half didn’t. Preliminary results showed that adding a citizenship question to the 2020 Census wouldn’t have had an impact on overall response rates, even though earlier studies had suggested its inclusion would reduce participation among Hispanics, immigrants and noncitizens. Later analysis showed it would have made a difference in bilingual neighborhoods that had substantial numbers of non-citizens, Hispanics and Asians.
Instead of focusing on census tracts, which encompass neighborhoods as in the 2019 study, the new study narrowed the focus to individual households, using administrative records.
“The inclusion of a citizenship question increases the undercount of households with noncitizens,” the researchers concluded.
During the 2020 census, the Black population had a net undercount of 3.3%, while it was almost 5% for Hispanics and 5.6% for American Indians and Native Alaskans living on reservations. The non-Hispanic white population had a net overcount of 1.6%, and Asians had a net overcount of 2.6%, according to the 2020 census results.
The once-a-decade head count determines how many congressional seats and Electoral College votes each state gets. It also guides the distribution of $2.8 trillion in annual federal spending.
The research paper was produced by the bureau’s Center for Economic Studies, whose papers typically haven’t undergone the review given to other Census Bureau publications. The opinions are those of the researchers and not the statistical agency, according to the bureau.
Follow Mike Schneider on the social platform X: @MikeSchneiderAP .

- Venue: Shaw Centre, Ottawa
- Registration
- Visa and Travel Authorization
- Travelling to Ottawa
- Getting Around Ottawa
- Code of Conduct
- Equity, Diversity, and Inclusion Plan
- Fun Activities
- Sponsorship
- Research and Experience Papers
- Doctoral Symposium
- Industry Talks
- CAIN 2025 Committees
- Organizing Committee
- Steering Committee
- Track Committees
- Contributors
- People Index
Research and Experience Papers CAIN 2025
Call for submissions.
We invite submissions of research and experience papers in two categories:
- Long paper : Long papers are research or experience papers describing research results, case studies, or insights from industry experience. A research or experience full paper is up to 10 pages plus a maximum of 2 pages for references.
- Short paper : Papers describing new challenges, new research results, visionary ideas, or experiences from, or in cooperation with, practitioners are welcome as short papers. In-progress research with interim results is also appropriate for a short paper. A short paper is up to 5 pages plus a maximum of 1 page for references.
The paper submissions will undergo a double-anonymous review process with three independent reviews and a virtual PC discussion. Acceptance criteria include contribution to the field of software engineering for AI, novelty, research and industrial relevance, soundness, and results. The accepted full and short papers will be published in the ICSE Companion proceedings.
If a paper is rejected as a long paper because the reviewers consider that the research is in the early stages or lacking evaluation, the paper will be reevaluated as a short paper. If accepted as a short paper, authors can choose to accept or decline to resubmit as a short paper.
Important Dates
- Abstracts: Nov 19, 2024, AoE (recommended; used for bidding)
- Papers: Nov 26, 2024, AoE (firm; no extensions)
- Notifications: Jan 21, 2025, AoE
- Camera Ready: Feb 12, 2025, AoE
Scope and Topics of Interest
The area of interest for CAIN is Software Engineering for AI — improving the development of AI-based systems throughout the full life cycle. Topics include but are not limited to:
- System and software requirements and their relationship to AI/ML modeling.
- Data management ensuring relevance and efficiency related to business goals.
- System and software architecture for AI-enabled systems.
- Integration of AI and software development processes into the AI system development life cycle, including continuous integration and deployment, and system and software evolution.
- Ensuring and managing system and software nonfunctional properties and their relationship to AI/ML properties, including runtime properties such as performance, safety, security, and reliability; and life-cycle properties including reusability, maintainability and evolution.
- Collaboration, organizational, and management practices for a successful development of AI-enabled systems.
- Building effective infrastructures to support development of AI systems and components.
- Further clarifications on the CAIN Scope
Note: Submissions that report strictly on data science or model development without any connection to software engineering and AI-enabled systems will be desk-rejected. As stated earlier, there are many venues for those papers where authors would get much more valuable and relevant feedback.
Submission Form
Research and experience papers should be submitted to (TBA). The submission deadline is firm, no extensions.
All submissions must adhere to the following requirements:
- Page limit is 10 pages plus 2 additional pages of references for long papers and 5 pages plus 1 additional page for references for short papers.
- Submissions must be unpublished original work and should not be under review or submitted elsewhere while being under consideration.
- By submitting to CAIN, authors acknowledge that they are aware of and agree to be bound by the ACM Policy and Procedures on Plagiarism and IEEE Plagiarism FAQ . The authors also acknowledge that they conform to the authorship policy of the ACM and the authorship policy of the IEEE .
- Authors’ names must be omitted from the submitted paper.
- All references to the author’s prior work should be in the third person.
- Authors are encouraged to title their submission differently than preprints of the authors on ArXiV or similar sites. During review, authors should not publicly use the submission title.
Submissions must conform to the IEEE conference proceedings template, specified in the IEEE Conference Proceedings Formatting Guidelines (title in 24pt font and full text in 10pt type, LaTeX users must use \documentclass[10pt,conference]{IEEEtran} without including the compsoc or compsocconf options).
Accepted papers will be published in the ICSE 2025 Co-located Event Proceedings and included in the IEEE and ACM Digital Libraries. Authors of accepted papers are required to register and present their accepted paper at the conference in order for the paper to be included in the proceedings and the Digital Libraries.
The official publication date is the date the proceedings are made available in the ACM or IEEE Digital Libraries. This date may be up to two weeks prior to the first day of ICSE 2025. The official publication date affects the deadline for any patent filings related to published work.
Authors of papers receiving a Conditional Accept decision are expected to submit the revised papers with changes marked in a different color, such as using LaTeXdiff. The authors also need to submit an “Author Response” document capturing the authors’ response to each reviewer comment and how those comments were addressed in the revision. This is similar to the “Summary of Changes and Response” document that is typically submitted by authors for a journal paper major revision. The reviewers will check the revised paper against the original paper and the suggested changes. Conditional Accepts will be checked by only one member of the Program Committee, and this will be done in one pass.
Authors of rejected long papers may receive an acceptance as a short paper if the PC chairs and reviewers agree that it better meets the criteria for short papers. In this case, authors may decide to accept or reject the invitation if they would rather submit as a long paper to a different venue.
Similarly, authors of rejected long and short papers relevant to the field of AI Engineering may have their papers sent to a different CAIN track. Also in this case, authors may decide to accept or reject the invitation.
Submission Process
Research and experience papers should be submitted to HotCrp (link TBD). The submission deadline is firm, with no extensions.
- Submissions must be in PDF and strictly conform to the IEEE conference proceedings formatting instructions. Alterations of spacing, font size, and other changes that deviate from the instructions may result in desk rejection without further review.
- All submissions must conform to the IEEE conference proceedings template, specified in the IEEE Conference Proceedings Formatting Guidelines (title in 24pt font and full text in 10pt type, LaTeX users must use \documentclass[10pt, conference]{IEEEtran} without including the compsoc or compsocconf options). Submissions must strictly conform to the IEEE conference proceedings formatting instructions specified above. Alterations of spacing, font size, and other changes that deviate from the instructions may result in desk rejection without further review.
- By submitting to CAIN, authors acknowledge that they are aware of and agree to be bound by the ACM Policy and Procedures on Plagiarism and the IEEE Plagiarism FAQ. Papers submitted to CAIN 2025 must not have been published elsewhere and must not be under review or submitted for review elsewhere while under consideration for CAIN 2025. Contravention of this concurrent submission policy will be deemed a serious breach of scientific ethics, and appropriate action will be taken in all such cases. To check for double submission and plagiarism issues, the chairs reserve the right to (1) share the list of submissions with the PC Chairs of other conferences with overlapping review periods and (2) use external plagiarism detection software, under contract to the ACM or IEEE, to detect violations of these policies.
- By submitting to the CAIN, authors acknowledge that they conform to the authorship policy of the ACM, and the authorship policy of the IEEE.
- If the research involves human participants/subjects, the authors must adhere to the ACM Publications Policy on Research Involving Human Participants and Subjects. Upon submitting, authors will declare their compliance with such a policy. Alleged violations of this policy or any ACM Publications Policy will be investigated by ACM and may result in a full retraction of your paper, in addition to other potential penalties, as per ACM Publications Policy.
- Please ensure that you and your co-authors obtain an ORCID ID, so you can complete the publishing process for your accepted paper. ACM and IEEE have been involved in ORCID and may collect ORCID IDs from all published authors. We are committed to improve author discoverability, ensure proper attribution and contribute to ongoing community efforts around name normalization; your ORCID ID will help in these efforts.
- No members yet
Have a language expert improve your writing
Run a free plagiarism check in 10 minutes, automatically generate references for free.
- Knowledge Base
- Methodology
- Questionnaire Design | Methods, Question Types & Examples
Questionnaire Design | Methods, Question Types & Examples
Published on 6 May 2022 by Pritha Bhandari . Revised on 10 October 2022.
A questionnaire is a list of questions or items used to gather data from respondents about their attitudes, experiences, or opinions. Questionnaires can be used to collect quantitative and/or qualitative information.
Questionnaires are commonly used in market research as well as in the social and health sciences. For example, a company may ask for feedback about a recent customer service experience, or psychology researchers may investigate health risk perceptions using questionnaires.
Table of contents
Questionnaires vs surveys, questionnaire methods, open-ended vs closed-ended questions, question wording, question order, step-by-step guide to design, frequently asked questions about questionnaire design.
A survey is a research method where you collect and analyse data from a group of people. A questionnaire is a specific tool or instrument for collecting the data.
Designing a questionnaire means creating valid and reliable questions that address your research objectives, placing them in a useful order, and selecting an appropriate method for administration.
But designing a questionnaire is only one component of survey research. Survey research also involves defining the population you’re interested in, choosing an appropriate sampling method , administering questionnaires, data cleaning and analysis, and interpretation.
Sampling is important in survey research because you’ll often aim to generalise your results to the population. Gather data from a sample that represents the range of views in the population for externally valid results. There will always be some differences between the population and the sample, but minimising these will help you avoid sampling bias .
Prevent plagiarism, run a free check.
Questionnaires can be self-administered or researcher-administered . Self-administered questionnaires are more common because they are easy to implement and inexpensive, but researcher-administered questionnaires allow deeper insights.
Self-administered questionnaires
Self-administered questionnaires can be delivered online or in paper-and-pen formats, in person or by post. All questions are standardised so that all respondents receive the same questions with identical wording.
Self-administered questionnaires can be:
- Cost-effective
- Easy to administer for small and large groups
- Anonymous and suitable for sensitive topics
But they may also be:
- Unsuitable for people with limited literacy or verbal skills
- Susceptible to a nonreponse bias (most people invited may not complete the questionnaire)
- Biased towards people who volunteer because impersonal survey requests often go ignored
Researcher-administered questionnaires
Researcher-administered questionnaires are interviews that take place by phone, in person, or online between researchers and respondents.
Researcher-administered questionnaires can:
- Help you ensure the respondents are representative of your target audience
- Allow clarifications of ambiguous or unclear questions and answers
- Have high response rates because it’s harder to refuse an interview when personal attention is given to respondents
But researcher-administered questionnaires can be limiting in terms of resources. They are:
- Costly and time-consuming to perform
- More difficult to analyse if you have qualitative responses
- Likely to contain experimenter bias or demand characteristics
- Likely to encourage social desirability bias in responses because of a lack of anonymity
Your questionnaire can include open-ended or closed-ended questions, or a combination of both.
Using closed-ended questions limits your responses, while open-ended questions enable a broad range of answers. You’ll need to balance these considerations with your available time and resources.
Closed-ended questions
Closed-ended, or restricted-choice, questions offer respondents a fixed set of choices to select from. Closed-ended questions are best for collecting data on categorical or quantitative variables.
Categorical variables can be nominal or ordinal. Quantitative variables can be interval or ratio. Understanding the type of variable and level of measurement means you can perform appropriate statistical analyses for generalisable results.
Examples of closed-ended questions for different variables
Nominal variables include categories that can’t be ranked, such as race or ethnicity. This includes binary or dichotomous categories.
It’s best to include categories that cover all possible answers and are mutually exclusive. There should be no overlap between response items.
In binary or dichotomous questions, you’ll give respondents only two options to choose from.
White Black or African American American Indian or Alaska Native Asian Native Hawaiian or Other Pacific Islander
Ordinal variables include categories that can be ranked. Consider how wide or narrow a range you’ll include in your response items, and their relevance to your respondents.
Likert-type questions collect ordinal data using rating scales with five or seven points.
When you have four or more Likert-type questions, you can treat the composite data as quantitative data on an interval scale . Intelligence tests, psychological scales, and personality inventories use multiple Likert-type questions to collect interval data.
With interval or ratio data, you can apply strong statistical hypothesis tests to address your research aims.
Pros and cons of closed-ended questions
Well-designed closed-ended questions are easy to understand and can be answered quickly. However, you might still miss important answers that are relevant to respondents. An incomplete set of response items may force some respondents to pick the closest alternative to their true answer. These types of questions may also miss out on valuable detail.
To solve these problems, you can make questions partially closed-ended, and include an open-ended option where respondents can fill in their own answer.
Open-ended questions
Open-ended, or long-form, questions allow respondents to give answers in their own words. Because there are no restrictions on their choices, respondents can answer in ways that researchers may not have otherwise considered. For example, respondents may want to answer ‘multiracial’ for the question on race rather than selecting from a restricted list.
- How do you feel about open science?
- How would you describe your personality?
- In your opinion, what is the biggest obstacle to productivity in remote work?
Open-ended questions have a few downsides.
They require more time and effort from respondents, which may deter them from completing the questionnaire.
For researchers, understanding and summarising responses to these questions can take a lot of time and resources. You’ll need to develop a systematic coding scheme to categorise answers, and you may also need to involve other researchers in data analysis for high reliability .
Question wording can influence your respondents’ answers, especially if the language is unclear, ambiguous, or biased. Good questions need to be understood by all respondents in the same way ( reliable ) and measure exactly what you’re interested in ( valid ).
Use clear language
You should design questions with your target audience in mind. Consider their familiarity with your questionnaire topics and language and tailor your questions to them.
For readability and clarity, avoid jargon or overly complex language. Don’t use double negatives because they can be harder to understand.
Use balanced framing
Respondents often answer in different ways depending on the question framing. Positive frames are interpreted as more neutral than negative frames and may encourage more socially desirable answers.
| Positive frame | Negative frame |
|---|---|
| Should protests of pandemic-related restrictions be allowed? | Should protests of pandemic-related restrictions be forbidden? |
Use a mix of both positive and negative frames to avoid bias , and ensure that your question wording is balanced wherever possible.
Unbalanced questions focus on only one side of an argument. Respondents may be less likely to oppose the question if it is framed in a particular direction. It’s best practice to provide a counterargument within the question as well.
| Unbalanced | Balanced |
|---|---|
| Do you favour …? | Do you favour or oppose …? |
| Do you agree that …? | Do you agree or disagree that …? |
Avoid leading questions
Leading questions guide respondents towards answering in specific ways, even if that’s not how they truly feel, by explicitly or implicitly providing them with extra information.
It’s best to keep your questions short and specific to your topic of interest.
- The average daily work commute in the US takes 54.2 minutes and costs $29 per day. Since 2020, working from home has saved many employees time and money. Do you favour flexible work-from-home policies even after it’s safe to return to offices?
- Experts agree that a well-balanced diet provides sufficient vitamins and minerals, and multivitamins and supplements are not necessary or effective. Do you agree or disagree that multivitamins are helpful for balanced nutrition?
Keep your questions focused
Ask about only one idea at a time and avoid double-barrelled questions. Double-barrelled questions ask about more than one item at a time, which can confuse respondents.
This question could be difficult to answer for respondents who feel strongly about the right to clean drinking water but not high-speed internet. They might only answer about the topic they feel passionate about or provide a neutral answer instead – but neither of these options capture their true answers.
Instead, you should ask two separate questions to gauge respondents’ opinions.
Strongly Agree Agree Undecided Disagree Strongly Disagree
Do you agree or disagree that the government should be responsible for providing high-speed internet to everyone?
You can organise the questions logically, with a clear progression from simple to complex. Alternatively, you can randomise the question order between respondents.
Logical flow
Using a logical flow to your question order means starting with simple questions, such as behavioural or opinion questions, and ending with more complex, sensitive, or controversial questions.
The question order that you use can significantly affect the responses by priming them in specific directions. Question order effects, or context effects, occur when earlier questions influence the responses to later questions, reducing the validity of your questionnaire.
While demographic questions are usually unaffected by order effects, questions about opinions and attitudes are more susceptible to them.
- How knowledgeable are you about Joe Biden’s executive orders in his first 100 days?
- Are you satisfied or dissatisfied with the way Joe Biden is managing the economy?
- Do you approve or disapprove of the way Joe Biden is handling his job as president?
It’s important to minimise order effects because they can be a source of systematic error or bias in your study.
Randomisation
Randomisation involves presenting individual respondents with the same questionnaire but with different question orders.
When you use randomisation, order effects will be minimised in your dataset. But a randomised order may also make it harder for respondents to process your questionnaire. Some questions may need more cognitive effort, while others are easier to answer, so a random order could require more time or mental capacity for respondents to switch between questions.
Follow this step-by-step guide to design your questionnaire.
Step 1: Define your goals and objectives
The first step of designing a questionnaire is determining your aims.
- What topics or experiences are you studying?
- What specifically do you want to find out?
- Is a self-report questionnaire an appropriate tool for investigating this topic?
Once you’ve specified your research aims, you can operationalise your variables of interest into questionnaire items. Operationalising concepts means turning them from abstract ideas into concrete measurements. Every question needs to address a defined need and have a clear purpose.
Step 2: Use questions that are suitable for your sample
Create appropriate questions by taking the perspective of your respondents. Consider their language proficiency and available time and energy when designing your questionnaire.
- Are the respondents familiar with the language and terms used in your questions?
- Would any of the questions insult, confuse, or embarrass them?
- Do the response items for any closed-ended questions capture all possible answers?
- Are the response items mutually exclusive?
- Do the respondents have time to respond to open-ended questions?
Consider all possible options for responses to closed-ended questions. From a respondent’s perspective, a lack of response options reflecting their point of view or true answer may make them feel alienated or excluded. In turn, they’ll become disengaged or inattentive to the rest of the questionnaire.
Step 3: Decide on your questionnaire length and question order
Once you have your questions, make sure that the length and order of your questions are appropriate for your sample.
If respondents are not being incentivised or compensated, keep your questionnaire short and easy to answer. Otherwise, your sample may be biased with only highly motivated respondents completing the questionnaire.
Decide on your question order based on your aims and resources. Use a logical flow if your respondents have limited time or if you cannot randomise questions. Randomising questions helps you avoid bias, but it can take more complex statistical analysis to interpret your data.
Step 4: Pretest your questionnaire
When you have a complete list of questions, you’ll need to pretest it to make sure what you’re asking is always clear and unambiguous. Pretesting helps you catch any errors or points of confusion before performing your study.
Ask friends, classmates, or members of your target audience to complete your questionnaire using the same method you’ll use for your research. Find out if any questions were particularly difficult to answer or if the directions were unclear or inconsistent, and make changes as necessary.
If you have the resources, running a pilot study will help you test the validity and reliability of your questionnaire. A pilot study is a practice run of the full study, and it includes sampling, data collection , and analysis.
You can find out whether your procedures are unfeasible or susceptible to bias and make changes in time, but you can’t test a hypothesis with this type of study because it’s usually statistically underpowered .
A questionnaire is a data collection tool or instrument, while a survey is an overarching research method that involves collecting and analysing data from people using questionnaires.
Closed-ended, or restricted-choice, questions offer respondents a fixed set of choices to select from. These questions are easier to answer quickly.
Open-ended or long-form questions allow respondents to answer in their own words. Because there are no restrictions on their choices, respondents can answer in ways that researchers may not have otherwise considered.
A Likert scale is a rating scale that quantitatively assesses opinions, attitudes, or behaviours. It is made up of four or more questions that measure a single attitude or trait when response scores are combined.
To use a Likert scale in a survey , you present participants with Likert-type questions or statements, and a continuum of items, usually with five or seven possible responses, to capture their degree of agreement.
You can organise the questions logically, with a clear progression from simple to complex, or randomly between respondents. A logical flow helps respondents process the questionnaire easier and quicker, but it may lead to bias. Randomisation can minimise the bias from order effects.
Questionnaires can be self-administered or researcher-administered.
Researcher-administered questionnaires are interviews that take place by phone, in person, or online between researchers and respondents. You can gain deeper insights by clarifying questions for respondents or asking follow-up questions.
Cite this Scribbr article
If you want to cite this source, you can copy and paste the citation or click the ‘Cite this Scribbr article’ button to automatically add the citation to our free Reference Generator.
Bhandari, P. (2022, October 10). Questionnaire Design | Methods, Question Types & Examples. Scribbr. Retrieved 27 July 2024, from https://www.scribbr.co.uk/research-methods/questionnaire-design/
Is this article helpful?

Pritha Bhandari
Other students also liked, doing survey research | a step-by-step guide & examples, what is a likert scale | guide & examples, reliability vs validity in research | differences, types & examples.
Subscribe to the PwC Newsletter
Join the community, edit social preview.

Add a new code entry for this paper
Remove a code repository from this paper, mark the official implementation from paper authors, add a new evaluation result row.
| TASK | DATASET | MODEL | METRIC NAME | METRIC VALUE | GLOBAL RANK | REMOVE |
|---|
Remove a task
Add a method, remove a method, edit datasets, a survey on differential privacy for spatiotemporal data in transportation research.
18 Jul 2024 · Rahul Bhadani · Edit social preview
With low-cost computing devices, improved sensor technology, and the proliferation of data-driven algorithms, we have more data than we know what to do with. In transportation, we are seeing a surge in spatiotemporal data collection. At the same time, concerns over user privacy have led to research on differential privacy in applied settings. In this paper, we look at some recent developments in differential privacy in the context of spatiotemporal data. Spatiotemporal data contain not only features about users but also the geographical locations of their frequent visits. Hence, the public release of such data carries extreme risks. To address the need for such data in research and inference without exposing private information, significant work has been proposed. This survey paper aims to summarize these efforts and provide a review of differential privacy mechanisms and related software. We also discuss related work in transportation where such mechanisms have been applied. Furthermore, we address the challenges in the deployment and mass adoption of differential privacy in transportation spatiotemporal data for downstream analyses.
Code Edit Add Remove Mark official
Tasks edit add remove, datasets edit, results from the paper edit add remove, methods edit add remove.

An official website of the United States government
The .gov means it’s official. Federal government websites often end in .gov or .mil. Before sharing sensitive information, make sure you’re on a federal government site.
The site is secure. The https:// ensures that you are connecting to the official website and that any information you provide is encrypted and transmitted securely.
- Publications
- Account settings
Preview improvements coming to the PMC website in October 2024. Learn More or Try it out now .
- Advanced Search
- Journal List
- Indian Dermatol Online J
- v.12(2); Mar-Apr 2021
Practical Guidelines to Develop and Evaluate a Questionnaire
Kamal kishore.
Department of Biostatistics, Post Graduate Institute of Medical Education and Research (PGIMER), Chandigarh, India
Vidushi Jaswal
1 Department of Psychology, MCM DAV College for Women, Chandigarh, India
Vinay Kulkarni
2 Department of Dermatology, PRAYAS Health Group, Amrita Clinic, Karve Road, Pune, Maharashtra, India
Dipankar De
3 Department of Dermatology, Post Graduate Institute of Medical Education and Research (PGIMER), Chandigarh, India
Life expectancy is gradually increasing due to continuously improving medical and nonmedical interventions. The increasing life expectancy is desirable but brings in issues such as impairment of quality of life, disease perception, cognitive health, and mental health. Thus, questionnaire building and data collection through the questionnaires have become an active area of research. However, questionnaire development can be challenging and suboptimal in the absence of careful planning and user-friendly literature guide. Keeping in mind the intricacies of constructing a questionnaire, researchers need to carefully plan, document, and follow systematic steps to build a reliable and valid questionnaire. Additionally, questionnaire development is technical, jargon-filled, and is not a part of most of the graduate and postgraduate training. Therefore, this article is an attempt to initiate an understanding of the complexities of the questionnaire fundamentals, technical challenges, and sequential flow of steps to build a reliable and valid questionnaire.
Introduction
There is an increase in the usage of the questionnaires to understand and measure patients' perception of medical and nonmedical care. Recently, with increased interest in quality of life associated with chronic diseases, there is a surge in the usage and types of questionnaires. The questionnaires are also known as scales and instruments. Their significant advantage is that they capture information about unobservable characteristics such as attitude, belief, intention, or behavior. The multiple items measuring specific domains of interest are required to obtain hidden (latent) information from participants. However, the importance of questions or items needs to be validated and evaluated individually and holistically.
The item formulation is an integral part of the scale construction. The literature consists of many approaches, such as Thurstone, Rasch, Gutmann, or Likert methods for framing an item. The Thurstone scale is labor intensive, time-consuming, and is practically not better than the Likert scale.[ 1 ] In the Guttman method, cumulative attributes of the respondents are measured with a group of items framed from the “easiest” to the “most difficult.” For example, for a stem, a participant may have to choose from options (a) stand, (b) walk, (c) jog, and (d) run. It requires a strict ordering of items. The Rasch method adds the stochastic component to the Guttman method which lay the foundation of modern and powerful technique item response theory for scale construction. All the approaches have their fair share of advantages and disadvantages. However, Likert scales based on classical testing theory are widely established and preferred by researchers to capture intrinsic characteristics. Therefore, in this article, we will discuss only psychometric properties required to build a Likert scale.
A hallmark of scientific research is that it needs to meet rigorous scientific standards. A questionnaire evaluates characteristics whose value can significantly change with time, place, and person. The error variance, along with systematic variation, plays a significant part in ascertaining unobservable characteristics. Therefore, it is critical to evaluate the instruments testing human traits rigorously. Such evaluations are known as psychometric evaluations in context to questionnaire development and validation. The scientific standards are available to select items, subscales, and entire scales. The researchers can broadly segment scientific criteria for a questionnaire into reliability and validity.
Despite increasing usage, many academicians grossly misunderstand the scales. The other complication is that many authors in the past did not adhere to the rigorous standards. Thus, the questionnaire-based research was criticized by many in the past for being a soft science.[ 2 ] The scale construction is also not a part of most of the graduate and postgraduate training. Given the previous discussion, the primary objective of this article is to sensitize researchers about the various intricacies and importance of each step for scale construction. The emphasis is also to make researcher aware and motivate to use multiple metrics to assess psychometric properties. Table 1 describes a glossary of essential terminologies used in context to questionnaire.
Glossary of important terms used in context to psychometric scale
| Term | Definition |
|---|---|
| Psychometrics | A science which deals with the quantitative assessment of abilities that are not directly observable, e.g., confidence, intelligence |
| Reliability | Refer to the degree of consistency of instrument in measurements, e.g., is weighing machine giving similar results under consistent conditions? |
| Validity | Refer to the ability of an instrument to represent the intended measure correctly, e.g., is weighing machine giving accurate results? |
| Likert scale | A psychometric scale consists of multiple items that arrived through a systematic evaluation of reliability and validity, e.g., quality-of-life score |
| Likert Item | It is a statement with a fixed set of choices to express an opinion with the level of agreement or disagreement |
| Latent variable | Represent a concept or underlying construct which cannot be measured directly. Latent variables are also known as unobserved variables, e.g., health and socioeconomic status |
| Manifest variable | A variable which can be measured directly. Manifest variables are also known as observed variables, e.g., blood pressure and income |
| Double-barrel item | A question addressing two or more separate issues but provides an option for one answer, e.g., do you like the house and locality? |
| Negative item | It is an item which is in the opposite direction from most of the questions on a scale |
| Factor loadings | Demonstrate the correlation coefficient between the observed variable and factor. It quantifies the strength of the relationship between a latent variable (factor) and manifest variables. It is key to understand the relative importance of items in the final questionnaire. An item with high factor loading is more important than others |
| Cross-loading | An observed variable with loading more than threshold value on two or more factors, e.g., education level with value >0.35 for both teaching and research domains. The items with cross-loadings are candidates for deletion from a questionnaire |
| Reverse scoring | The practice of reversing the score to cancel positive and negative loading on the same factor, e.g., changing the maximum rating (such as strongly agree=5) to a minimum (such as strongly agree=1) or vice versa |
| Floor and ceiling effect | The inability of a scale to discriminate between participants in a study as the high proportion of participants score worst/minimum or best/maximum score, e.g., more than 80% responses are received by single option among the five options for a Likert item. Item is poorly discriminating between participants and is a candidate for deletion |
| Eigenvalue | An indicator of the amount of variance explained by a factor. The factor with the highest eigenvalue explains the maximum amount of variance and practically makes a factor most important. The eigenvalue is obtained by column sum of squares of factor loading |
The process of building a questionnaire starts with item generation, followed by questionnaire development, and concludes with rigorous scientific evaluation. Figure 1 summarizes the systematic steps and respective tasks at each stage to build a good questionnaire. There are specific essential requirements which are not directly a part of scale development and evaluation; however, these improve the utility of the instrument. The indirect but necessary conditions are documented and discussed under the miscellaneous category. We broadly segment and discuss the questionnaire development process under three domains, known as questionnaire development, questionnaire evaluation, and miscellaneous properties.

Flowchart demonstrating the various steps involved in the development of a questionnaire
Questionnaire Development
The development of the list of items is an essential and mandatory prerequisite for developing a good questionnaire. The researcher at this stage decides to utilize formats such as Guttman, Rasch, or Likert to frame items.[ 2 ] Further, the researcher carefully identifies the appropriate member of the expert panel group for face and content validity. Broadly, there are six steps in the scale development.
It is crucial to select appropriate questions (items) to capture the latent trait. An exhaustive list of items is the most critical and primary requisite to lay the foundation of a good questionnaire. It needs considerable work in terms of literature search, qualitative study, discussion with colleagues, other experts, general and targeted responders, and other questionnaires in and around the area of interest. General and targeted participants can also advise on items, wording, and smoothness of questionnaire as they will be the potential responders.
It is crucial to arrange and reword the pool of questions for eliminating ambiguity, technical jargon, and loading. Further, one should avoid using double-barreled, long, and negatively worded questions. Arrange all items systematically to form a preliminary draft of the questionnaire. After generating an initial draft, review the instrument for the flow of items, face validity and content validity before sending it to experts. The researcher needs to assess whether the items in the score are comprehensive (content validity) and appear to measure what it is supposed to measure (face validity). For example, does the scale measuring stress is measuring stress or is it measuring depression instead? There is no uniformity on the selection of a panel of experts. However, a general agreement is to use anywhere from a minimum of 5–15 experts in a group.[ 3 ] These experts will ascertain the face and content validity of the questionnaire. These are subjective and objective measures of validity, respectively.
It is advisable to prepare an appealing, jargon-free, and nontechnical cover letter explaining the purpose and description of the instrument. Further, it is better to include the reason/s for selecting the expert, scoring format, and explanations of response categories for the scale. It is advantageous to speak with experts telephonically, face to face, or electronically, requesting their participation before mailing the questionnaire. It is good to explain to them right in the beginning that this process unfolds over phases. The time allowed to respond can vary from hours to weeks. It is recommended to give at least 7 days to respond. However, a nonresponse needs to be followed up by a reminder email or call. Usually, this stage takes two to three rounds. Therefore, it is essential to engage with experts regularly; else there is a risk of nonresponse from the study. Table 2 gives general advice to researchers for making a cover letter. The researcher can modify the cover letter appropriately for their studies. The authors can consult Rubio and coauthors for more details regarding the drafting of a cover letter.[ 4 ]
General overview and the instructions for rating in the cover letter to be accompanied by the questionnaire
| Content | Explanation | ||
|---|---|---|---|
| Construct | Definition of characteristics of the measurement | ||
| Purpose | To evaluate the content and face validity | ||
| How | Please rate each item for its representativeness and clarity on a scale from 1 to 4 | ||
| Evaluate the comprehensiveness of the entire instrument in measuring the domain | |||
| Please add, delete, or modify any item as per your understanding | |||
| Scoring | 0-Not necessary | 1-Not representative | 1-Not clear |
| 1-Useful | 2-Need major revisions to be representative | 2-Need major revisions to be clear | |
| 2-Essential | 3-Need minor revisions to be representative | 3-Need minor revisions to be clear | |
| 4-Representative | 4-Clear | ||
| Formula | CVR = ( - /2)/( /2) | CVI = / | CVI = / |
| where =number of experts rated an item as essential | where CVI =CVI for representativeness | where CVI =CVI for clarity | |
| =Number of experts rated an item as representative (3 or 4) | =Number of experts rated an item as clear (3 or 4) | ||
| =Total number of experts | =Total number of experts | ||
The responses from each round will help in rewording, rephrasing, and reordering of the items in the scale. Few questions may need deletion in the different rounds of previous steps. Therefore, it is better to evaluate content validity ratio (CVR), content validity index (CVI), and interrater agreement before deleting any question in the instrument. Readers can consult formulae in Table 2 for calculating CVR and CVI for the instrument. CVR is calculated and reported for the overall scale, whereas CVI is computed for each item. Researchers need to consult Lawshe table to determine the cutoff value for CVR as the same depends on the number of experts in the panel.[ 5 ] CVI >0.80 is recommended. Researchers interested in detail regarding CVR and CVI can read excellent articles written by Zamanzadeh et al . and Rubio et al .[ 4 , 6 ] It is crucial to compute CVR, CVI, and kappa agreement for each item from the rating of importance, representativeness, and clarity by experts. The CVR and CVI do not account for a chance factor. Since interrater agreement (IRA) incorporates chance factor; it is better to report CVR, CVI, and IRA measures.
The scholars require to address subtle issues before administering a questionnaire to responders for pilot testing. The introduction and format of the scale play a crucial role in mitigating doubts and maximizing response. The front page of the questionnaire provides an overview of the research without using technical words. Further, it includes roles and responsibilities of the participants, contact details of researchers, list of research ethics (such as voluntary participation, confidentiality and withdrawal, risks and benefits), and informed consent for participation in the study. It is also better to incorporate anchors (levels of Likert item) in each page at the top or bottom or both for ease and maximizing response. Readers can refer to Table 3 for detail.
A random set of questions with anchors at the top and bottom row
| Items | Strongly disagree (SD) | Disagree (D) | Neutral (N) | Agree (A) | Strongly agree (SA) |
|---|---|---|---|---|---|
| Duration of disease (since onset) | SD | D | N | A | SA |
| Number of relapse(s) of the disease | SD | D | N | A | SA |
| Duration of oral erosions (present episode) | SD | D | N | A | SA |
| Number of relapse(s) of oral lesions | SD | D | N | A | SA |
| Persistence of oral lesions after subsidence of cutaneous lesions | SD | D | N | A | SA |
| Change in size of existing lesion in last 1 week | SD | D | N | A | SA |
| Development of new lesions in last 1 week | SD | D | N | A | SA |
| Difficulty in eating normal food | SD | D | N | A | SA |
| Difficulty in eating food according to their consistency | SD | D | N | A | SA |
| Inability to eat spicy food | SD | D | N | A | SA |
| Inability to drink fruit juices | SD | D | N | A | SA |
| Excessive salivation/drooling | SD | D | N | A | SA |
| Difficulty in speaking | SD | D | N | A | SA |
| Difficulty in brushing teeth | SD | D | N | A | SA |
| Difficulty in swallowing | SD | D | N | A | SA |
| Restricted mouth opening | SD | D | N | A | SA |
| Strongly disagree | Disagree | Neutral | Agree | Strongly agree |
Pilot testing of an instrument in the target population is an important and essential requirement before testing on a large sample of individuals. It helps in the elimination or revision of poorly worded items. At this stage, it is better to use floor and ceiling effects to eliminate poorly discriminating items. Further, random interviews of 5–10 participants can help to mitigate the problems such as difficulty, relevance, confusion, and order of the questions before testing it on the study population. The general recommendations are to recruit a sample size between 30 and 100 for pilot testing.[ 4 ] Inter-question (item) correlation (IQC) and Cronbach's α can be assessed at this stage. The values less than 0.3 and 0.7, respectively, for IQC and reliability, are suspicious and candidate for elimination from the questionnaire. Cronbach's α, a measure of internal consistency and IQC of a scale, indicates researcher about the quality of items in measuring latent attribute at the initial stage. This process is important to refine and finalize the questionnaire before starting the testing of a questionnaire in study participants.
Questionnaire Evaluation
The preliminary items and the questionnaire until this stage have addressed issues of reliability, validity, and overall appeal in the target population. However, researchers need to rigorously evaluate the psychometric properties of the primary instrument before finally adopting. The first step in this process is to calculate the appropriate sample size for administering a preliminary questionnaire in the target group. The evaluations of various measures do not follow a sequential order like the previous stage. Nevertheless, these measures are critical to evaluate the reliability and validity of the questionnaire.
Correct data entry is the first requirement to evaluate the characteristics of a manually administered questionnaire. The primary need is to enter the data into an appropriate spreadsheet. Subsequently, clean the data for cosmetic and logical errors. Finally, prepare a master sheet, and data dictionary for analysis and reference to coding, respectively. Authors interested in more detail can read “Biostatistics Series.”[ 7 , 8 ] The data entry process of the questionnaire is like other cross-sectional study designs. The rows and columns represent participants and variables, respectively. It is better to enter the set of items with item numbers. First, it is tedious and time-consuming to find suitable variable names for many questions. Second, item numbers help in quick identification of significantly contributing and non-contributing items of the scale during the assessment of psychometric properties. Readers can see Table 4 for more detail.
A sample of data entry format
| (a) Illustration of master sheet | ||||||||
|---|---|---|---|---|---|---|---|---|
| Participant | Age | Religion | Family | Height | Weight | Q1 | Q2 | Q3 |
| 1 | 25 | 1 | 1 | 185.0 | 85.0 | 1 | 5 | 2 |
| 2 | 26 | 3 | 1 | 155.0 | 63.0 | 2 | 5 | 1 |
| 3 | 22 | 2 | 2 | 155.0 | 57.0 | 4 | 2 | 1 |
| 4 | 35 | 2 | 1 | 158.5 | 67.5 | 3 | 2 | 2 |
| 5 | 49 | 1 | 2 | 175.0 | 64.0 | 2 | 4 | 3 |
| 6 | 40 | 4 | 1 | 159.0 | 78.0 | 2 | 4 | 3 |
| Q → th Question in the questionnaire, where =1,2,3, … | ||||||||
| | | | ||||||
| Participant | A random serial number to participant | None | String | |||||
| Age | Age in years | None (30-70 years) | Interval | |||||
| Religion | Religion of the participant | 1=Hindu 2=Sikh 3=Muslim 4=Others | Nominal | |||||
| Q | Level of agreement in the question | 1=Strongly disagree 2=Disagree 3=Neutral 4=Agree 5=Strongly agree | Ordinal | |||||
Descriptive statistics
Spreadsheets are easy and flexible for routine data entry and cleaning. However, the same lack the features of advanced statistical analysis. Therefore, the master sheet needs to be exported to appropriate software for advanced statistical analysis. Descriptive analysis is the usual first step which helps in understanding the fundamental characteristics of the data. Thus, report appropriate descriptive measures such as mean and standard deviation, and median and interquartile/interdecile range for continuous symmetric and asymmetric data, respectively.[ 9 ] Utilize exploratory tabular and graphical display to inspect the distribution of various items in the questionnaire. A stacked bar chart is a handy tool to investigate the distribution of data graphically. Further, ascertain linearity and lack of extreme multicollinearity at this stage. Any value of IQC >0.7 warrants further inspection for deletion or modification. Help from a good biostatistician is of great assistance for data analysis and reporting.
Missing data analysis
Missing data is the rule, not the exception. Majority of the researchers face difficulties of finding missing values in the data. There are usually three approaches to analyze incomplete data. The first approach is to “take all” which use all the available data for analysis. In the second method, the analyst deletes the participants and variables with gross missingness or both from the analysis process. The third scenario consists of estimating the percentage and type of missingness. The typically recommended threshold for the missingness is 5%.[ 10 ] There are broadly three types of missingness, such as missing completely at random, missing at random, and not missing at random. After identification of a missing mechanism, impute the data with single or multiple imputation approaches. Readers can refer to an excellent article written by Graham for more details about missing data.[ 11 ]
Sample size
The optimum sample size is a vital requisite to build a good questionnaire. There are many guidelines in the literature regarding recruiting an appropriate sample size. Literature broadly segments sample size approaches into three domains known as subject to variables ratio (SVR), minimum sample size, and factor loadings (FL). The factor analysis (FA) is a crucial component of questionnaire designing. Therefore, recent recommendations are to use FLs to determine sample size. Readers can consult Table 5 for sample size recommendations under various domains. Interested readers can refer to Beavers and colleagues for more detail.[ 12 ] The stability of the factors is essential to determine sample size. Therefore, data analysis from questionnaires validates the sample size after data collection. The Kaiser–Meyer–Olkin (KMO) criterion testing the adequacy of sample size is available in the majority of the statistical software packages. A higher value of KMO is an indicator of sufficient sample size for stable factor solution.
Sample size recommendations in the literature
| Sample size criteria | ||
|---|---|---|
| Subject to variables ratio | Minimum sample size | Factor loading |
| Minimum 100 participants + SVR ≥5 | At least 300 participants | At least 4 items with FL >0.60 (minimum 100 participants) |
| 51 participants + number of variables | At least 200 participants | At least 10 items with FL >0.40 (minimum 150 participants) |
| At least SVR >5 | At least 150-300 participants | Items with 0.30 ≤ FL ≤0.40 (minimum 300 participants) |
SVR→Subject to variable ratio, FL→Factor loading
Correlation measures
The strength of relationships between the items is an imperative requisite for a stable factor solution. Therefore, the correlation matrix is calculated and ascertained for same. There are various recommendations of correlation coefficient; however, a value greater than 0.3 is a must.[ 13 ] A lower value of the correlation coefficient will fail to form a stable factor due to lack of commonality. The determinant and Bartlett's test of sphericity can be used to ascertain the stability of the factors. The determinant is a single value which ranges from zero to one. A nonzero determinant indicates that factors are possible. However, it is small in most of the studies and not easy to interpret. Therefore, Bartlett's test of sphericity is routinely used to infer that determinant is significantly different than zero.
Physical quantities such as height and weight are observable and measurable with instruments. However, many tools need regular calibration to be precise and accurate. The standardization in context to the questionnaire development is known as reliability and validity. The validity is the property which indicates that an instrument is measuring what it is supposed to measure. Validation is a continuous process which begins with the identification of domains and goes on till generalization. There are various measures to establish the validity of the instrument. Authors can consult Table 6 for different types of validity and their metrics.
Scientific standards to evaluate and report for constructing a good scale
| Psychometric properties | Component | Definition | Indices |
|---|---|---|---|
| Validity | Content validity | The items are addressing all the relevant aspect of construct | Content validity ratio Content validity indices Interrater agreement |
| Face validity | The test appears to measure the intended measure | Expert opinion (qualitative) | |
| Construct validity | The strong ( ) and weak ( ) correlation between same and different construct, respectively | Exploratory factor analysis Correlation coefficient | |
| Criterion validity | The correlation between a predictor measure (teamwork) and criterion measures (actual performance in team) | Correlation coefficient | |
| Convergent validity | The correlation between a scale and conceptually similar scales or subscales of a scale | Correlation coefficient Multitrait-multimethod matrix | |
| Reliability | Internal consistency | The cohesiveness of items in measuring the same variable consistently | Coefficient α Coefficient β Coefficient Ω |
| Test-retest | Consistency of score for stable characteristics on separate times | Correlation coefficient Intra-class correlation coefficient | |
| Alternate forms | Consistency of scores among the same sample for similar tests | Correlation coefficient | |
| Descriptive analysis | Tabular display | Display of essential data characteristics in rows and columns | Mean (SD) Median (IQR) |
| Graphical display | Visual display of large data to exhibit trends, patterns, and relationships | Box plot Bar graph | |
| Missing | MCAR | Missing data is independent of observed or unobserved data | Little’s MCAR |
| mechanism | MAR | Missing data is related to observed but not unobserved data | Listing and Schlittgen (LS) test |
| NMAR | Missing data is related to unobserved data | No standard test (based on assumptions) | |
| Factorability | Sample size | Minimum number of participants required to measure study outcomes | KMO criteria |
| Correlation matrix | A matrix displaying the inter-correlations among the variables | Determinant | |
| Sphericity | Refers to equality of correlations between different items | Bartlett’s test |
MCAR: Missing completely at random; MAR: Missing at random; NMAR: Not missing at random; KMO: Kaiser-Meyer-Olkin; SD: Standard deviation; IQR: Interquartile range
Exploratory FA
FA assumes that there are underlying constructs (factors) which cannot be measured directly. Therefore, the investigator collects the exhaustive list of observed variables or responses representing underlying constructs. Researchers expect that variables or questions in the questionnaire correlate among themselves and load on the corresponding but a small number of factors. FA can be broadly segmented in exploratory factor analysis (EFA) and confirmatory factor analysis. The EFA is applied on the master sheet after assessing descriptive statistics such as tabular and graphical display, missing mechanism, sample size adequacy, IQC, and Bartlett's test in step 7 [ Figure 1 ]. The value of EFA is used at the initial stages to extract factors while constructing a questionnaire. It is especially important to identify an adequate number of factors for building a decent scale. The factors represent latent variables that explain variance in the observed data. First and the last factor explain maximum and minimum variance, respectively. There are multiple factor selection criteria, each with its advantages and disadvantages. It is better to utilize more than one approach for retaining factors during the initial extraction phase. Readers can consult Sindhuja et al . for the practical application of more than one-factor selection criteria.[ 14 ]
Kaiser's criterion
Kaiser's criterion is one of the most popular factor retention criteria. The basis of the Kaiser criterion is to explain the variance through the eigenvalue approach. A factor with more than one eigenvalue is the candidate for retention.[ 15 ] An eigenvalue bigger than one simply means that a single factor is explaining variance for more than one observed variable. However, there is a dearth of scientifically rigorous studies to declare a cutoff value for Kaiser's criterion. Many authors highlighted that the Kaiser criterion over-extract and under-extract factors.[ 16 , 17 ] Therefore, investigators need to calculate and consider other measures for extraction of factors.
Cattell's scree plot
Cattell's scree plot is another widespread eigenvalue-based factor selection criterion used by researchers. It is popularly known as scree plot. The scree plot assigns the eigenvalues on the y -axis against the number of factors in the x -axis. The factors with highest to lowest eigenvalues are plotted from left to right on the x -axis. Usually, the scree plots form an elbow which indicates the cutoff point for factor extraction. The location or the bend at which the curve first begins to straighten out indicates the maximum number of factors to retain. A significant disadvantage of the scree plot is the subjectivity of the researcher's perception of the “elbow” in the plot. Researchers can see Figure 2 for detail.

A hypothetical example showing the researcher's dilemma of selecting 6, 10, or 15 factors through scree plot
Percentage of variance
The variance extraction criterion is another criterion to retain the number of factors. The literature recommendation varies from more than a minimum of 50–70% onward.[ 12 ] However, both the number of items and factors will increase dramatically if there are a large number of manifest (observed) variables. Practically, the percentage of variance explained mechanism should be used judiciously along with FL. The FLs with greater than 0.4 value are preferred; however, there are recommendations to use a value higher than 0.30.[ 3 , 15 , 18 ]
Very simple structure
Very simple structure (VSS) approach is a symbiosis of theory, psychometrics, and statistical analysis. The VSS criterion compares the fit of the simplified model to the original correlations. It plots the goodness-of-fit value as a function of several factors rather than statistical significance. The number of factors that maximizes the VSS criterion suggests the optimal number of factors to extract. VSS criterion facilitates comparison of a different number of factors for varying complexity. VSS will be highest at the optimum number of factors.[ 19 ] However, it is not efficient for factorially complex data.
Parallel analysis
Parallel analysis (PA) is a statistical theory-based robust technique to identify the appropriate number of factors. It is the only technique which accounts for the probability that a factor is due to chance. PA simulates data to generate 95 th percentile cutoff line on a scree plot restricted upon the number of items and sample size in original data. The factors above the cutoff line are not due to chance. PA is the most robust empirical technique to retain the appropriate number of factors.[ 16 , 20 ] However, it should be used cautiously for the eigenvalue near the 95 th percentile cutoff line. PA is also robust to distributional assumptions of the data. Since different techniques have their fair share of advantages and disadvantages, researchers need to assess information on the basis of multiple criteria.
Reliability
Reliability, an essential requisite of a scale, is also known as reproducibility, repeatability, and consistency. It identifies that the instrument is consistently measuring the attribute under identical conditions. Reliability is a necessary characteristic of a tool. The trustworthiness of a scale can be increased by increasing and decreasing the systematic and random component, respectively. The reliability of an instrument can be further segmented and measured with various indices. Reliability is important but it is secondary to validity. Therefore, it is ideal to calculate and report reliability after validity. However, there are no hard and fast rules except that both are necessary and important measures. Readers may consult Table 6 for multiple types of indices for reliability.
Internal consistency
Cronbach's alpha (α), also known as α-coefficient, is one of the most used statistics to report internal consistency reliability. The internal consistency using the interitem correlations suggests the cohesiveness of items in a questionnaire. However, the α-coefficient is sample-specific; thus, the literature recommends the same to calculate and report for all the studies. Ideally, a value of α >0.70 is preferred; however, the value of α >0.60 is also accepted for construction of new scale.[ 21 , 22 ] Researchers can increase the α-coefficient by adding items in the scale. However, a value can either reduce with the addition of non-correlated items or deletion of correlated items. Corrected interitem correlation is another popular measure to report for internal consistency. A value of α <0.3 indicates the presence of nonrelated items. The studies claim that coefficient beta (β) and omega (Ω) are better indices than coefficient-α, but there is a scarcity of literature reporting these indices.[ 23 ]
Test–retest
Test–retest reliability measures the stability of an instrument over time. In other words, it measures the consistency of scores over time. However, the appropriate time between repeated measures is a debatable issue. Pearson's product-moment and intraclass correlation coefficient measure and report test–retest reliability. A high value of correlation >0.70 represents high reliability.[ 21 ] The change in study condition (recovery of patients after intervention) over time can decrease test–retest reliability. Therefore, it is important to report the time between repeated measures while reporting test–retest reliability.
Parallel forms and split-half reliability
Parallel form reliability is also known as an alternate form of consistency. There are two types of option to report parallel form reliability. In the first method, different but similar items make alternative forms of the test. The assumptions of both the assessment are that they measure the same phenomenon or underlying construct. It addresses the twin issues of time and knowledge acquisition of test in test–retest reliability. In the second approach, the researcher randomly divides the total items of an instrument into two halves. The calculation of parallel form from two halves is known as split-half reliability. However, randomly divided half may not be similar. The parallel from and split-half reliability are reported with the correlation coefficient. The recommendations are to use a value higher than 0.80 to assess the alternate form of consistency.[ 24 ] It is challenging to generate two types of tests in clinical studies. Therefore, researchers rarely report reliability from two analogous but separate tests.
General Questionnaire Properties
The major issues regarding the reliability and validity of scale development have already been discussed. However, there are many other subtle issues for developing a good questionnaire. These delicate issues may vary from a choice of Likert items, length of the instrument, cover letter, web or internet mode of data collection, and weighting of scale. The immediately preceding issues demand careful deliberation and attention from the researcher. Therefore, the researcher should carefully think through all these issues to build a good questionnaire.
Likert items
The Likert items are the fixed choice ordinal items which capture attitude, belief, and various other latent domains. The subsequent step is to rank the questions of the Likert scale for further analysis. The numerals for ranking can either start from 0 or 1. It does not make a difference. The Likert scale is primarily bipolar as opposite ends endorse the contrary idea.[ 2 ] These are the type of items which express opinions on a measure from strong disagreement to strong agreement. The adjectival scales are unipolar scale that tends to measure variables like pain intensity (no pain/mild pain/moderate pain/severe pain) in one direction. However, the Likert scale (most likely–least likely) can measure almost any attribute. The Likert scale can either have odd or even categories; however, odd categories are more popular. The number of classifications in the Likert scale can vary from anywhere between 3 and 11,[ 2 ] although the scale with 5 and 7 classes have displayed better statistical properties for discriminating between responses.[ 2 , 24 ]
Length of questionnaire
A good questionnaire needs to include many items to capture the construct of interest. Therefore, investigators need to collect as many questions as possible. However, the lengthier scale increases both time and cost. The response rate also decreases with an increase in the length of the questionnaire.[ 25 ] Although what is lengthy is debatable and varies from more than 4 pages to 12 pages in various studies,[ 26 ] the longer scales increase the false positivity rate.[ 27 ]
Translating a questionnaire
Many a time, there are already existing reliable and valid questionnaires for use. However, the expert needs to assess two immediate and important criteria of cultural sensitivity and language of the scale. Many sensitive questions on sexual preferences, political orientations, societal structure, and religion may be open for discussion in certain societies, religions, and cultures, whereas the same may be taboo or receive misreporting in others. The sensitive questions need to be reframed considering regional sentiments and culture in mind. Further, a questionnaire in different language needs to be translated by a minimum of two independent bilingual translators. Similarly, the translated questionnaire needs to be translated back into the original language by a minimum of two independent and different bilingual experts who converted the original questionnaire. The process of converting the original questionnaire to the targeted language and then back to the original language is known as forward and backward translation. The subsequent steps such as expert panel group, pilot testing, reliability, and validity for translating a questionnaire remain the same as in constructing a new scale.
Web-based or paper-based
Broadly, paper and electronic format are the two modes of administering a questionnaire to the participants. Both techniques have advantages and disadvantages. The response rate is a significant issue in self-administered scales. The significant benefits of electronic format are the reduction in cost, time, and data cleaning requirements. In contrast, paper-based administration of questionnaire increases external generalization, paper feel, and no need of internet. As per Greenlaw and Welty, the response rate improves with the availability of both the options to participants. However, cost and time increase in comparison to the usage of electronic format alone.[ 27 ]
Item order and weights
There are multiple ways to order an item in a questionnaire. The order of questions becomes more critical for a lengthy questionnaire. There are different opinions about either grouping or mixing the issues in an instrument.[ 24 ] Grouping inflates intra-scale correlation, whereas mixing inflates inter-scale correlation.[ 28 ] Both the approaches have empirically shown to give similar results for at least 20 or more items. The questions related to a particular domain can be assigned either equal or unequal weights. There are two mechanisms to assign unequal weights in a questionnaire. In the first situation, researchers affix different importance to items. In the second method, the investigators frame more or fewer questions as per the importance of subscales in the scale.
The fundamental triad of science is accuracy, precision, and objectivity. The increasing usage of questionnaires in medical sciences requires rigorous scientific evaluations before finally adopting it for routine use. There are no standard guidelines for questionnaire development, evaluation, and reporting in contrast to guidelines such as CONSORT, PRISMA, and STROBE for treatment development, evaluation, and reporting. In this article, we emphasize on the systematic and structured approach for building a good questionnaire. Failure to meet the questionnaire development standards may lead to biased, unreliable, and inaccurate study finding. Therefore, the general guidelines given in this article can be used to develop and validate an instrument before routine use.
Financial support and sponsorship
Conflicts of interest.
There are no conflicts of interest.
The state of AI in early 2024: Gen AI adoption spikes and starts to generate value
If 2023 was the year the world discovered generative AI (gen AI) , 2024 is the year organizations truly began using—and deriving business value from—this new technology. In the latest McKinsey Global Survey on AI, 65 percent of respondents report that their organizations are regularly using gen AI, nearly double the percentage from our previous survey just ten months ago. Respondents’ expectations for gen AI’s impact remain as high as they were last year , with three-quarters predicting that gen AI will lead to significant or disruptive change in their industries in the years ahead.
About the authors
This article is a collaborative effort by Alex Singla , Alexander Sukharevsky , Lareina Yee , and Michael Chui , with Bryce Hall , representing views from QuantumBlack, AI by McKinsey, and McKinsey Digital.
Organizations are already seeing material benefits from gen AI use, reporting both cost decreases and revenue jumps in the business units deploying the technology. The survey also provides insights into the kinds of risks presented by gen AI—most notably, inaccuracy—as well as the emerging practices of top performers to mitigate those challenges and capture value.
AI adoption surges
Interest in generative AI has also brightened the spotlight on a broader set of AI capabilities. For the past six years, AI adoption by respondents’ organizations has hovered at about 50 percent. This year, the survey finds that adoption has jumped to 72 percent (Exhibit 1). And the interest is truly global in scope. Our 2023 survey found that AI adoption did not reach 66 percent in any region; however, this year more than two-thirds of respondents in nearly every region say their organizations are using AI. 1 Organizations based in Central and South America are the exception, with 58 percent of respondents working for organizations based in Central and South America reporting AI adoption. Looking by industry, the biggest increase in adoption can be found in professional services. 2 Includes respondents working for organizations focused on human resources, legal services, management consulting, market research, R&D, tax preparation, and training.
Also, responses suggest that companies are now using AI in more parts of the business. Half of respondents say their organizations have adopted AI in two or more business functions, up from less than a third of respondents in 2023 (Exhibit 2).

Future frontiers: Navigating the next wave of tech innovations
Join Lareina Yee and Roger Roberts on Tuesday, July 30, at 12:30 p.m. EDT/6:30 p.m. CET as they discuss the future of these technological trends, the factors that will fuel their growth, and strategies for investing in them through 2024 and beyond.
Gen AI adoption is most common in the functions where it can create the most value
Most respondents now report that their organizations—and they as individuals—are using gen AI. Sixty-five percent of respondents say their organizations are regularly using gen AI in at least one business function, up from one-third last year. The average organization using gen AI is doing so in two functions, most often in marketing and sales and in product and service development—two functions in which previous research determined that gen AI adoption could generate the most value 3 “ The economic potential of generative AI: The next productivity frontier ,” McKinsey, June 14, 2023. —as well as in IT (Exhibit 3). The biggest increase from 2023 is found in marketing and sales, where reported adoption has more than doubled. Yet across functions, only two use cases, both within marketing and sales, are reported by 15 percent or more of respondents.
Gen AI also is weaving its way into respondents’ personal lives. Compared with 2023, respondents are much more likely to be using gen AI at work and even more likely to be using gen AI both at work and in their personal lives (Exhibit 4). The survey finds upticks in gen AI use across all regions, with the largest increases in Asia–Pacific and Greater China. Respondents at the highest seniority levels, meanwhile, show larger jumps in the use of gen Al tools for work and outside of work compared with their midlevel-management peers. Looking at specific industries, respondents working in energy and materials and in professional services report the largest increase in gen AI use.
Investments in gen AI and analytical AI are beginning to create value
The latest survey also shows how different industries are budgeting for gen AI. Responses suggest that, in many industries, organizations are about equally as likely to be investing more than 5 percent of their digital budgets in gen AI as they are in nongenerative, analytical-AI solutions (Exhibit 5). Yet in most industries, larger shares of respondents report that their organizations spend more than 20 percent on analytical AI than on gen AI. Looking ahead, most respondents—67 percent—expect their organizations to invest more in AI over the next three years.
Where are those investments paying off? For the first time, our latest survey explored the value created by gen AI use by business function. The function in which the largest share of respondents report seeing cost decreases is human resources. Respondents most commonly report meaningful revenue increases (of more than 5 percent) in supply chain and inventory management (Exhibit 6). For analytical AI, respondents most often report seeing cost benefits in service operations—in line with what we found last year —as well as meaningful revenue increases from AI use in marketing and sales.
Inaccuracy: The most recognized and experienced risk of gen AI use
As businesses begin to see the benefits of gen AI, they’re also recognizing the diverse risks associated with the technology. These can range from data management risks such as data privacy, bias, or intellectual property (IP) infringement to model management risks, which tend to focus on inaccurate output or lack of explainability. A third big risk category is security and incorrect use.
Respondents to the latest survey are more likely than they were last year to say their organizations consider inaccuracy and IP infringement to be relevant to their use of gen AI, and about half continue to view cybersecurity as a risk (Exhibit 7).
Conversely, respondents are less likely than they were last year to say their organizations consider workforce and labor displacement to be relevant risks and are not increasing efforts to mitigate them.
In fact, inaccuracy— which can affect use cases across the gen AI value chain , ranging from customer journeys and summarization to coding and creative content—is the only risk that respondents are significantly more likely than last year to say their organizations are actively working to mitigate.
Some organizations have already experienced negative consequences from the use of gen AI, with 44 percent of respondents saying their organizations have experienced at least one consequence (Exhibit 8). Respondents most often report inaccuracy as a risk that has affected their organizations, followed by cybersecurity and explainability.
Our previous research has found that there are several elements of governance that can help in scaling gen AI use responsibly, yet few respondents report having these risk-related practices in place. 4 “ Implementing generative AI with speed and safety ,” McKinsey Quarterly , March 13, 2024. For example, just 18 percent say their organizations have an enterprise-wide council or board with the authority to make decisions involving responsible AI governance, and only one-third say gen AI risk awareness and risk mitigation controls are required skill sets for technical talent.
Bringing gen AI capabilities to bear
The latest survey also sought to understand how, and how quickly, organizations are deploying these new gen AI tools. We have found three archetypes for implementing gen AI solutions : takers use off-the-shelf, publicly available solutions; shapers customize those tools with proprietary data and systems; and makers develop their own foundation models from scratch. 5 “ Technology’s generational moment with generative AI: A CIO and CTO guide ,” McKinsey, July 11, 2023. Across most industries, the survey results suggest that organizations are finding off-the-shelf offerings applicable to their business needs—though many are pursuing opportunities to customize models or even develop their own (Exhibit 9). About half of reported gen AI uses within respondents’ business functions are utilizing off-the-shelf, publicly available models or tools, with little or no customization. Respondents in energy and materials, technology, and media and telecommunications are more likely to report significant customization or tuning of publicly available models or developing their own proprietary models to address specific business needs.
Respondents most often report that their organizations required one to four months from the start of a project to put gen AI into production, though the time it takes varies by business function (Exhibit 10). It also depends upon the approach for acquiring those capabilities. Not surprisingly, reported uses of highly customized or proprietary models are 1.5 times more likely than off-the-shelf, publicly available models to take five months or more to implement.
Gen AI high performers are excelling despite facing challenges
Gen AI is a new technology, and organizations are still early in the journey of pursuing its opportunities and scaling it across functions. So it’s little surprise that only a small subset of respondents (46 out of 876) report that a meaningful share of their organizations’ EBIT can be attributed to their deployment of gen AI. Still, these gen AI leaders are worth examining closely. These, after all, are the early movers, who already attribute more than 10 percent of their organizations’ EBIT to their use of gen AI. Forty-two percent of these high performers say more than 20 percent of their EBIT is attributable to their use of nongenerative, analytical AI, and they span industries and regions—though most are at organizations with less than $1 billion in annual revenue. The AI-related practices at these organizations can offer guidance to those looking to create value from gen AI adoption at their own organizations.
To start, gen AI high performers are using gen AI in more business functions—an average of three functions, while others average two. They, like other organizations, are most likely to use gen AI in marketing and sales and product or service development, but they’re much more likely than others to use gen AI solutions in risk, legal, and compliance; in strategy and corporate finance; and in supply chain and inventory management. They’re more than three times as likely as others to be using gen AI in activities ranging from processing of accounting documents and risk assessment to R&D testing and pricing and promotions. While, overall, about half of reported gen AI applications within business functions are utilizing publicly available models or tools, gen AI high performers are less likely to use those off-the-shelf options than to either implement significantly customized versions of those tools or to develop their own proprietary foundation models.
What else are these high performers doing differently? For one thing, they are paying more attention to gen-AI-related risks. Perhaps because they are further along on their journeys, they are more likely than others to say their organizations have experienced every negative consequence from gen AI we asked about, from cybersecurity and personal privacy to explainability and IP infringement. Given that, they are more likely than others to report that their organizations consider those risks, as well as regulatory compliance, environmental impacts, and political stability, to be relevant to their gen AI use, and they say they take steps to mitigate more risks than others do.
Gen AI high performers are also much more likely to say their organizations follow a set of risk-related best practices (Exhibit 11). For example, they are nearly twice as likely as others to involve the legal function and embed risk reviews early on in the development of gen AI solutions—that is, to “ shift left .” They’re also much more likely than others to employ a wide range of other best practices, from strategy-related practices to those related to scaling.
In addition to experiencing the risks of gen AI adoption, high performers have encountered other challenges that can serve as warnings to others (Exhibit 12). Seventy percent say they have experienced difficulties with data, including defining processes for data governance, developing the ability to quickly integrate data into AI models, and an insufficient amount of training data, highlighting the essential role that data play in capturing value. High performers are also more likely than others to report experiencing challenges with their operating models, such as implementing agile ways of working and effective sprint performance management.
About the research
The online survey was in the field from February 22 to March 5, 2024, and garnered responses from 1,363 participants representing the full range of regions, industries, company sizes, functional specialties, and tenures. Of those respondents, 981 said their organizations had adopted AI in at least one business function, and 878 said their organizations were regularly using gen AI in at least one function. To adjust for differences in response rates, the data are weighted by the contribution of each respondent’s nation to global GDP.
Alex Singla and Alexander Sukharevsky are global coleaders of QuantumBlack, AI by McKinsey, and senior partners in McKinsey’s Chicago and London offices, respectively; Lareina Yee is a senior partner in the Bay Area office, where Michael Chui , a McKinsey Global Institute partner, is a partner; and Bryce Hall is an associate partner in the Washington, DC, office.
They wish to thank Kaitlin Noe, Larry Kanter, Mallika Jhamb, and Shinjini Srivastava for their contributions to this work.
This article was edited by Heather Hanselman, a senior editor in McKinsey’s Atlanta office.
Explore a career with us
Related articles.

Moving past gen AI’s honeymoon phase: Seven hard truths for CIOs to get from pilot to scale

A generative AI reset: Rewiring to turn potential into value in 2024

Implementing generative AI with speed and safety
An official website of the United States government
Here's how you know
Official websites use .gov A .gov website belongs to an official government organization in the United States.
Secure .gov websites use HTTPS A lock ( ) or https:// means you've safely connected to the .gov website. Share sensitive information only on official, secure websites.
CMS Newsroom
Search cms.gov.
- Physician Fee Schedule
- Local Coverage Determination
- Medically Unlikely Edits
- Data Quality Impacts of the Transition from In-person to Phone Data Collection for the Medicare Current Beneficiary Survey Working Paper
Suggestions or feedback?
MIT News | Massachusetts Institute of Technology
- Machine learning
- Sustainability
- Black holes
- Classes and programs
Departments
- Aeronautics and Astronautics
- Brain and Cognitive Sciences
- Architecture
- Political Science
- Mechanical Engineering
Centers, Labs, & Programs
- Abdul Latif Jameel Poverty Action Lab (J-PAL)
- Picower Institute for Learning and Memory
- Lincoln Laboratory
- School of Architecture + Planning
- School of Engineering
- School of Humanities, Arts, and Social Sciences
- Sloan School of Management
- School of Science
- MIT Schwarzman College of Computing
Large language models don’t behave like people, even though we may expect them to
Press contact :, media download.

*Terms of Use:
Images for download on the MIT News office website are made available to non-commercial entities, press and the general public under a Creative Commons Attribution Non-Commercial No Derivatives license . You may not alter the images provided, other than to crop them to size. A credit line must be used when reproducing images; if one is not provided below, credit the images to "MIT."

Previous image Next image
One thing that makes large language models (LLMs) so powerful is the diversity of tasks to which they can be applied. The same machine-learning model that can help a graduate student draft an email could also aid a clinician in diagnosing cancer.
However, the wide applicability of these models also makes them challenging to evaluate in a systematic way. It would be impossible to create a benchmark dataset to test a model on every type of question it can be asked.
In a new paper , MIT researchers took a different approach. They argue that, because humans decide when to deploy large language models, evaluating a model requires an understanding of how people form beliefs about its capabilities.
For example, the graduate student must decide whether the model could be helpful in drafting a particular email, and the clinician must determine which cases would be best to consult the model on.
Building off this idea, the researchers created a framework to evaluate an LLM based on its alignment with a human’s beliefs about how it will perform on a certain task.
They introduce a human generalization function — a model of how people update their beliefs about an LLM’s capabilities after interacting with it. Then, they evaluate how aligned LLMs are with this human generalization function.
Their results indicate that when models are misaligned with the human generalization function, a user could be overconfident or underconfident about where to deploy it, which might cause the model to fail unexpectedly. Furthermore, due to this misalignment, more capable models tend to perform worse than smaller models in high-stakes situations.
“These tools are exciting because they are general-purpose, but because they are general-purpose, they will be collaborating with people, so we have to take the human in the loop into account,” says study co-author Ashesh Rambachan, assistant professor of economics and a principal investigator in the Laboratory for Information and Decision Systems (LIDS).
Rambachan is joined on the paper by lead author Keyon Vafa, a postdoc at Harvard University; and Sendhil Mullainathan, an MIT professor in the departments of Electrical Engineering and Computer Science and of Economics, and a member of LIDS. The research will be presented at the International Conference on Machine Learning.
Human generalization
As we interact with other people, we form beliefs about what we think they do and do not know. For instance, if your friend is finicky about correcting people’s grammar, you might generalize and think they would also excel at sentence construction, even though you’ve never asked them questions about sentence construction.
“Language models often seem so human. We wanted to illustrate that this force of human generalization is also present in how people form beliefs about language models,” Rambachan says.
As a starting point, the researchers formally defined the human generalization function, which involves asking questions, observing how a person or LLM responds, and then making inferences about how that person or model would respond to related questions.
If someone sees that an LLM can correctly answer questions about matrix inversion, they might also assume it can ace questions about simple arithmetic. A model that is misaligned with this function — one that doesn’t perform well on questions a human expects it to answer correctly — could fail when deployed.
With that formal definition in hand, the researchers designed a survey to measure how people generalize when they interact with LLMs and other people.
They showed survey participants questions that a person or LLM got right or wrong and then asked if they thought that person or LLM would answer a related question correctly. Through the survey, they generated a dataset of nearly 19,000 examples of how humans generalize about LLM performance across 79 diverse tasks.
Measuring misalignment
They found that participants did quite well when asked whether a human who got one question right would answer a related question right, but they were much worse at generalizing about the performance of LLMs.
“Human generalization gets applied to language models, but that breaks down because these language models don’t actually show patterns of expertise like people would,” Rambachan says.
People were also more likely to update their beliefs about an LLM when it answered questions incorrectly than when it got questions right. They also tended to believe that LLM performance on simple questions would have little bearing on its performance on more complex questions.
In situations where people put more weight on incorrect responses, simpler models outperformed very large models like GPT-4.
“Language models that get better can almost trick people into thinking they will perform well on related questions when, in actuality, they don’t,” he says.
One possible explanation for why humans are worse at generalizing for LLMs could come from their novelty — people have far less experience interacting with LLMs than with other people.
“Moving forward, it is possible that we may get better just by virtue of interacting with language models more,” he says.
To this end, the researchers want to conduct additional studies of how people’s beliefs about LLMs evolve over time as they interact with a model. They also want to explore how human generalization could be incorporated into the development of LLMs.
“When we are training these algorithms in the first place, or trying to update them with human feedback, we need to account for the human generalization function in how we think about measuring performance,” he says.
In the meanwhile, the researchers hope their dataset could be used a benchmark to compare how LLMs perform related to the human generalization function, which could help improve the performance of models deployed in real-world situations.
“To me, the contribution of the paper is twofold. The first is practical: The paper uncovers a critical issue with deploying LLMs for general consumer use. If people don’t have the right understanding of when LLMs will be accurate and when they will fail, then they will be more likely to see mistakes and perhaps be discouraged from further use. This highlights the issue of aligning the models with people's understanding of generalization,” says Alex Imas, professor of behavioral science and economics at the University of Chicago’s Booth School of Business, who was not involved with this work. “The second contribution is more fundamental: The lack of generalization to expected problems and domains helps in getting a better picture of what the models are doing when they get a problem ‘correct.’ It provides a test of whether LLMs ‘understand’ the problem they are solving.”
This research was funded, in part, by the Harvard Data Science Initiative and the Center for Applied AI at the University of Chicago Booth School of Business.
Share this news article on:
Related links.
- Ashesh Rambachan
- Laboratory for Information and Decision Systems
- Department of Electrical Engineering and Computer Science
- Department of Economics
Related Topics
- Computer science and technology
- Artificial intelligence
- Human-computer interaction
- Laboratory for Information and Decision Systems (LIDS)
- School of Humanities Arts and Social Sciences
Related Articles

Reasoning skills of large language models are often overestimated

Technique improves the reasoning capabilities of large language models

Natural language boosts LLM performance in coding, planning, and robotics

Multi-AI collaboration helps reasoning and factual accuracy in large language models
Previous item Next item
More MIT News

Edgerton Center hosts workshop for deaf high school students in STEM
Read full story →

MIT Global SCALE Network expands by adding center at Loughborough University

New transistor’s superlative properties could have broad electronics applications

When learning at MIT means studying thousands of miles away

Flying high to enable sustainable delivery, remote care

Professor Emeritus Ralph Gakenheimer, mobility planner and champion of international development, dies at 89
- More news on MIT News homepage →
Massachusetts Institute of Technology 77 Massachusetts Avenue, Cambridge, MA, USA
- Map (opens in new window)
- Events (opens in new window)
- People (opens in new window)
- Careers (opens in new window)
- Accessibility
- Social Media Hub
- MIT on Facebook
- MIT on YouTube
- MIT on Instagram
COMMENTS
Questionnaires vs. surveys. A survey is a research method where you collect and analyze data from a group of people. A questionnaire is a specific tool or instrument for collecting the data.. Designing a questionnaire means creating valid and reliable questions that address your research objectives, placing them in a useful order, and selecting an appropriate method for administration.
The first question asks for a ready-made solution, and is not focused or researchable. The second question is a clearer comparative question, but note that it may not be practically feasible. For a smaller research project or thesis, it could be narrowed down further to focus on the effectiveness of drunk driving laws in just one or two countries.
The questionnaire is a tool widely used for data collection compared to interview and observation in empirical research; this study used Closed (multiple choice) and Open (descriptive) questions ...
For a more detailed review of the types of research questions, readers are referred to a paper by Boynton and Greenhalgh. USING PRE-EXISTING QUESTIONNAIRES VERSUS DEVELOPING A NEW QUESTIONNAIRE Before developing a questionnaire for a research study, a researcher can check whether there are any preexisting-validated questionnaires that might be ...
writing questions and building the construct of the questionnaire. It also develops the demand to pre-test the questionnaire and finalizing the questionnaire to conduct the survey. Keywords: Questionnaire, Academic Survey, Questionnaire Design, Research Methodology I. INTRODUCTION A questionnaire, as heart of the survey is based on a set of
Distribute the questionnaire: Distribute the questionnaire to your target audience using a method that is appropriate for your research objectives, such as online surveys, email, or paper surveys. Collect and analyze data: Collect the completed questionnaires and analyze the data using appropriate statistical methods.
Numerous research students and conference delegates provided methodological questions and case examples of real life questionnaire research, which provided the inspiration and raw material for this series. We also thank the hundreds of research participants who over the years have contributed data and given feedback to our students and ...
1. Early questions should be easy and pleasant to answer, and should build rapport between the respondent and the researcher. 2. Questions at the very beginning of a questionnaire should explicitly address the topic of the survey, as it was described to the respondent prior to the interview. 3. Questions on the same topic should be grouped ...
Six steps to good questionnaire design. #1: Identify your research aims and the goal of your questionnaire. #2: Define your target respondents. #3: Develop questions. #4: Choose your question type. #5: Design question sequence and overall layout. #6: Run a pilot. Free 44-page Experimental Design Guide. If you want to find out something about a ...
10. Test the Survey Platform: Ensure compatibility and usability for online surveys. By following these steps and paying attention to questionnaire design principles, you can create a well-structured and effective questionnaire that gathers reliable data and helps you achieve your research objectives.
Come up with a research question. It can be one question or several, but this should be the focal point of your questionnaire. Develop one or several hypotheses that you want to test. The questions that you include on your questionnaire should be aimed at systematically testing these hypotheses. 2.
Taherdoost, Hamed, Designing a Questionnaire for a Research Paper: A Comprehensive Guide to Design and Develop an Effective Questionnaire (August 1, 2022). Taherdoost, H. (2022). Designing a Questionnaire for a Research Paper: A Comprehensive Guide to Design and Develop an Effective Questionnaire, Asian Journal of Managerial Science, 11(1): 8-16.
Designing a Questionnaire for a Research Paper: A Comprehensive Guide to Design and Develop an Effective Questionnaire Hamed Taherdoost To cite this version: Hamed Taherdoost. Designing a Questionnaire for a Research Paper: A Comprehensive Guide to Design and Develop an Effective Questionnaire. Asian Journal of Managerial Science, 2022, 11, pp ...
A questionnaire is defined a market research instrument that consists of questions or prompts to elicit and collect responses from a sample of respondents. This article enlists 21 questionnaire templates along with samples and examples. It also describes the different types of questionnaires and the question types that are used in these questionnaires.
Guides to Survey Research. Managing and Manipulating Survey Data: A Beginners Guide; Finding and Hiring Survey Contractors; How to Frame and Explain the Survey Data Used in a Thesis; Overview of Cognitive Testing and Questionnaire Evaluation; Questionnaire Design Tip Sheet; Sampling, Coverage, and Nonresponse Tip Sheet; PSR Survey Toolbox
PMB has taught research methods in a primary care setting for the past 13 years, specialising in practical approaches and using the experiences and concerns of researchers and participants as the basis of learning. This series of papers arose directly from questions asked about real questionnaire studies.
An example of a pen-and-paper questionnaire with a clear, accessible design is the ... The aims of the study align with the research questions which are the principal impetus for this study. The ...
A questionnaire is an important instrument in a research study to help the researcher collect relevant data regarding the research topic. It is significant to ensure that the design of the questionnaire is arranged to minimize errors. However, researchers commonly face challenges in designing an effective questionnaire including its content, appearance and usage that leads to inappropriate and ...
Survey research means collecting information about a group of people by asking them questions and analysing the results. To conduct an effective survey, follow these six steps: Determine who will participate in the survey. Decide the type of survey (mail, online, or in-person) Design the survey questions and layout. Distribute the survey.
Survey research means collecting information about a group of people by asking them questions and analyzing the results. To conduct an effective survey, follow these six steps: Determine who will participate in the survey. Decide the type of survey (mail, online, or in-person) Design the survey questions and layout.
Before conducting a study, a research proposal should be created that outlines researchers' plans and methodology and is submitted to the concerned evaluating organization or person. Creating a research proposal is an important step to ensure that researchers are on track and are moving forward as intended. A research proposal can be defined as a detailed plan or blueprint for the proposed ...
The trial survey was conducted by the Census Bureau as the Trump administration unsuccessfully attempted to add a citizenship question to the 2020 head count's questionnaire. ... The research paper was produced by the bureau's Center for Economic Studies, whose papers typically haven't undergone the review given to other Census Bureau ...
Call for Submissions We invite submissions of research and experience papers in two categories: Long paper: Long papers are research or experience papers describing research results, case studies, or insights from industry experience. A research or experience full paper is up to 10 pages plus a maximum of 2 pages for references. Short paper: Papers describing new challenges, new research ...
Questionnaires vs surveys. A survey is a research method where you collect and analyse data from a group of people. A questionnaire is a specific tool or instrument for collecting the data.. Designing a questionnaire means creating valid and reliable questions that address your research objectives, placing them in a useful order, and selecting an appropriate method for administration.
Hence, the public release of such data carries extreme risks. To address the need for such data in research and inference without exposing private information, significant work has been proposed. This survey paper aims to summarize these efforts and provide a review of differential privacy mechanisms and related software.
Thus, the questionnaire-based research was criticized by many in the past for being a soft science. The scale construction is also not a part of most of the graduate and postgraduate training. ... Greenlaw C, Brown-Welty S. A comparison of web-based and paper-based survey methods: Testing assumptions of survey mode and response cost. Eval Rev ...
All papers, both invited and contributed, the accepted papers, will be published by IEEE (ISBN:979-8-3503-9095-7) and submitted for inclusion intoIEEE Xplore subject to meeting IEEE Xplore's ...
About the research. The online survey was in the field from February 22 to March 5, 2024, and garnered responses from 1,363 participants representing the full range of regions, industries, company sizes, functional specialties, and tenures. Of those respondents, 981 said their organizations had adopted AI in at least one business function, and ...
Data & Research; Search CMS.gov. Search Search. Popular terms. Physician Fee Schedule; Local Coverage Determination; Medically Unlikely Edits; Telehealth; Covid-19; CMS.gov main menu. ... Data Quality Impacts of the Transition from In-person to Phone Data Collection for the Medicare Current Beneficiary Survey Working Paper . Publish Year. 2024.
They showed survey participants questions that a person or LLM got right or wrong and then asked if they thought that person or LLM would answer a related question correctly. Through the survey, they generated a dataset of nearly 19,000 examples of how humans generalize about LLM performance across 79 diverse tasks. Measuring misalignment